

Check distribution of sources of traffic on a website
In this scenario, you will create a segmentation that allows you to understand the distribution of traffic to your website, in this example - mobile vs desktop visits.
This scenario assumes the default setup, in which a page.visit event has a source parameter that equals WEB_DESKTOP or MOBILEWEB depending on the client device.
Prerequisites
- Add a tracking code to your website.
Create segmentation
Create a segmentation that organizes customers by sources from which they visited the website.
- Go to Analytics > Segmentations > New segmentation.
- Enter a meaningful name of the segmentation.
- Add three segments by clicking Add segment.
- Name the segments as follows:
Mobile and Desktop,Mobile, andDesktop. - Define the conditions for each segment:
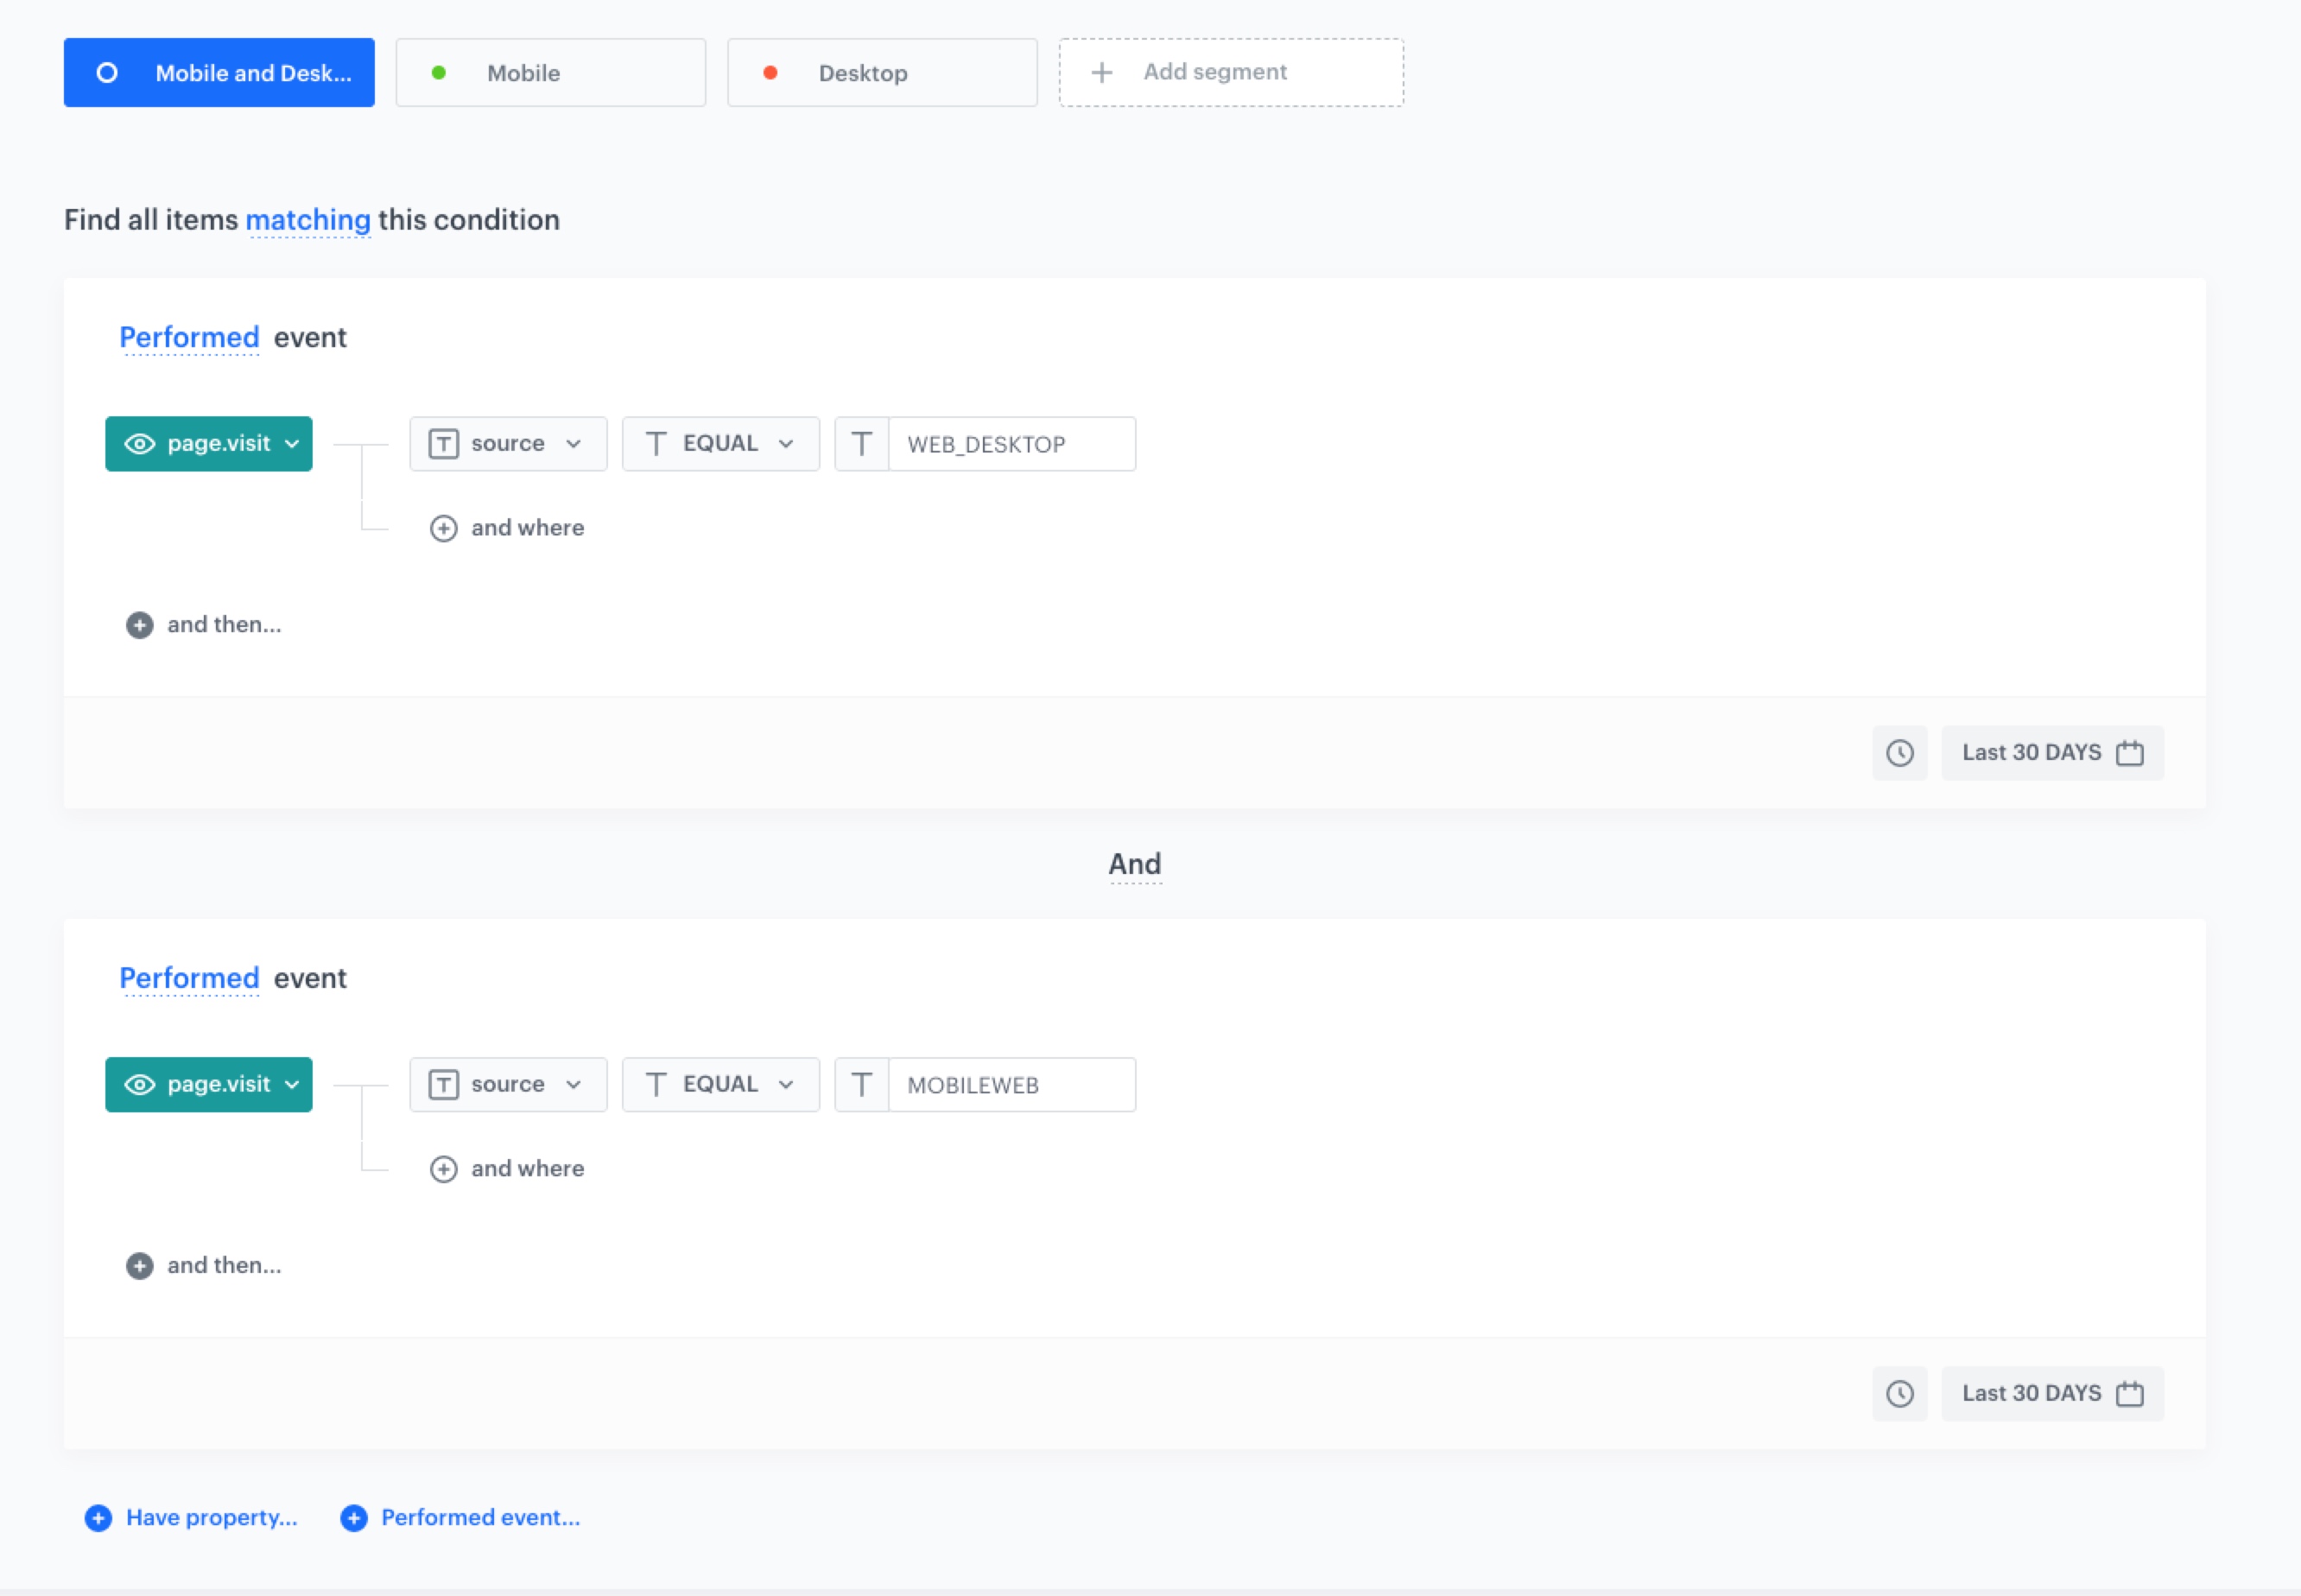
Mobile and Desktop
- Click Performed event….
- From the dropdown list, select page.visit.
- As the event parameter, select source.
- As the logical operator, select EQUAL.
- In the text field, enter
WEB_DESKTOP. - Click Performed event….
- From the dropdown list, select page.visit.
- As the event parameter, select source.
- As the logical operator, select EQUAL.
- In the text field, enter
MOBILEWEB. - Join the two conditions with the
Andlogical operator.
Mobile- Click Performed event….
- From the dropdown list, select page.visit.
- As the event parameter, select source.
- As the logical operator, select EQUAL.
- In the text field, enter
MOBILEWEB.
Desktop- Click Performed event….
- From the dropdown list, select page.visit.
- As the event parameter, select source.
- As the logical operator, select EQUAL.
- In the text field, enter
WEB_DESKTOP.
- Save your segmentation.
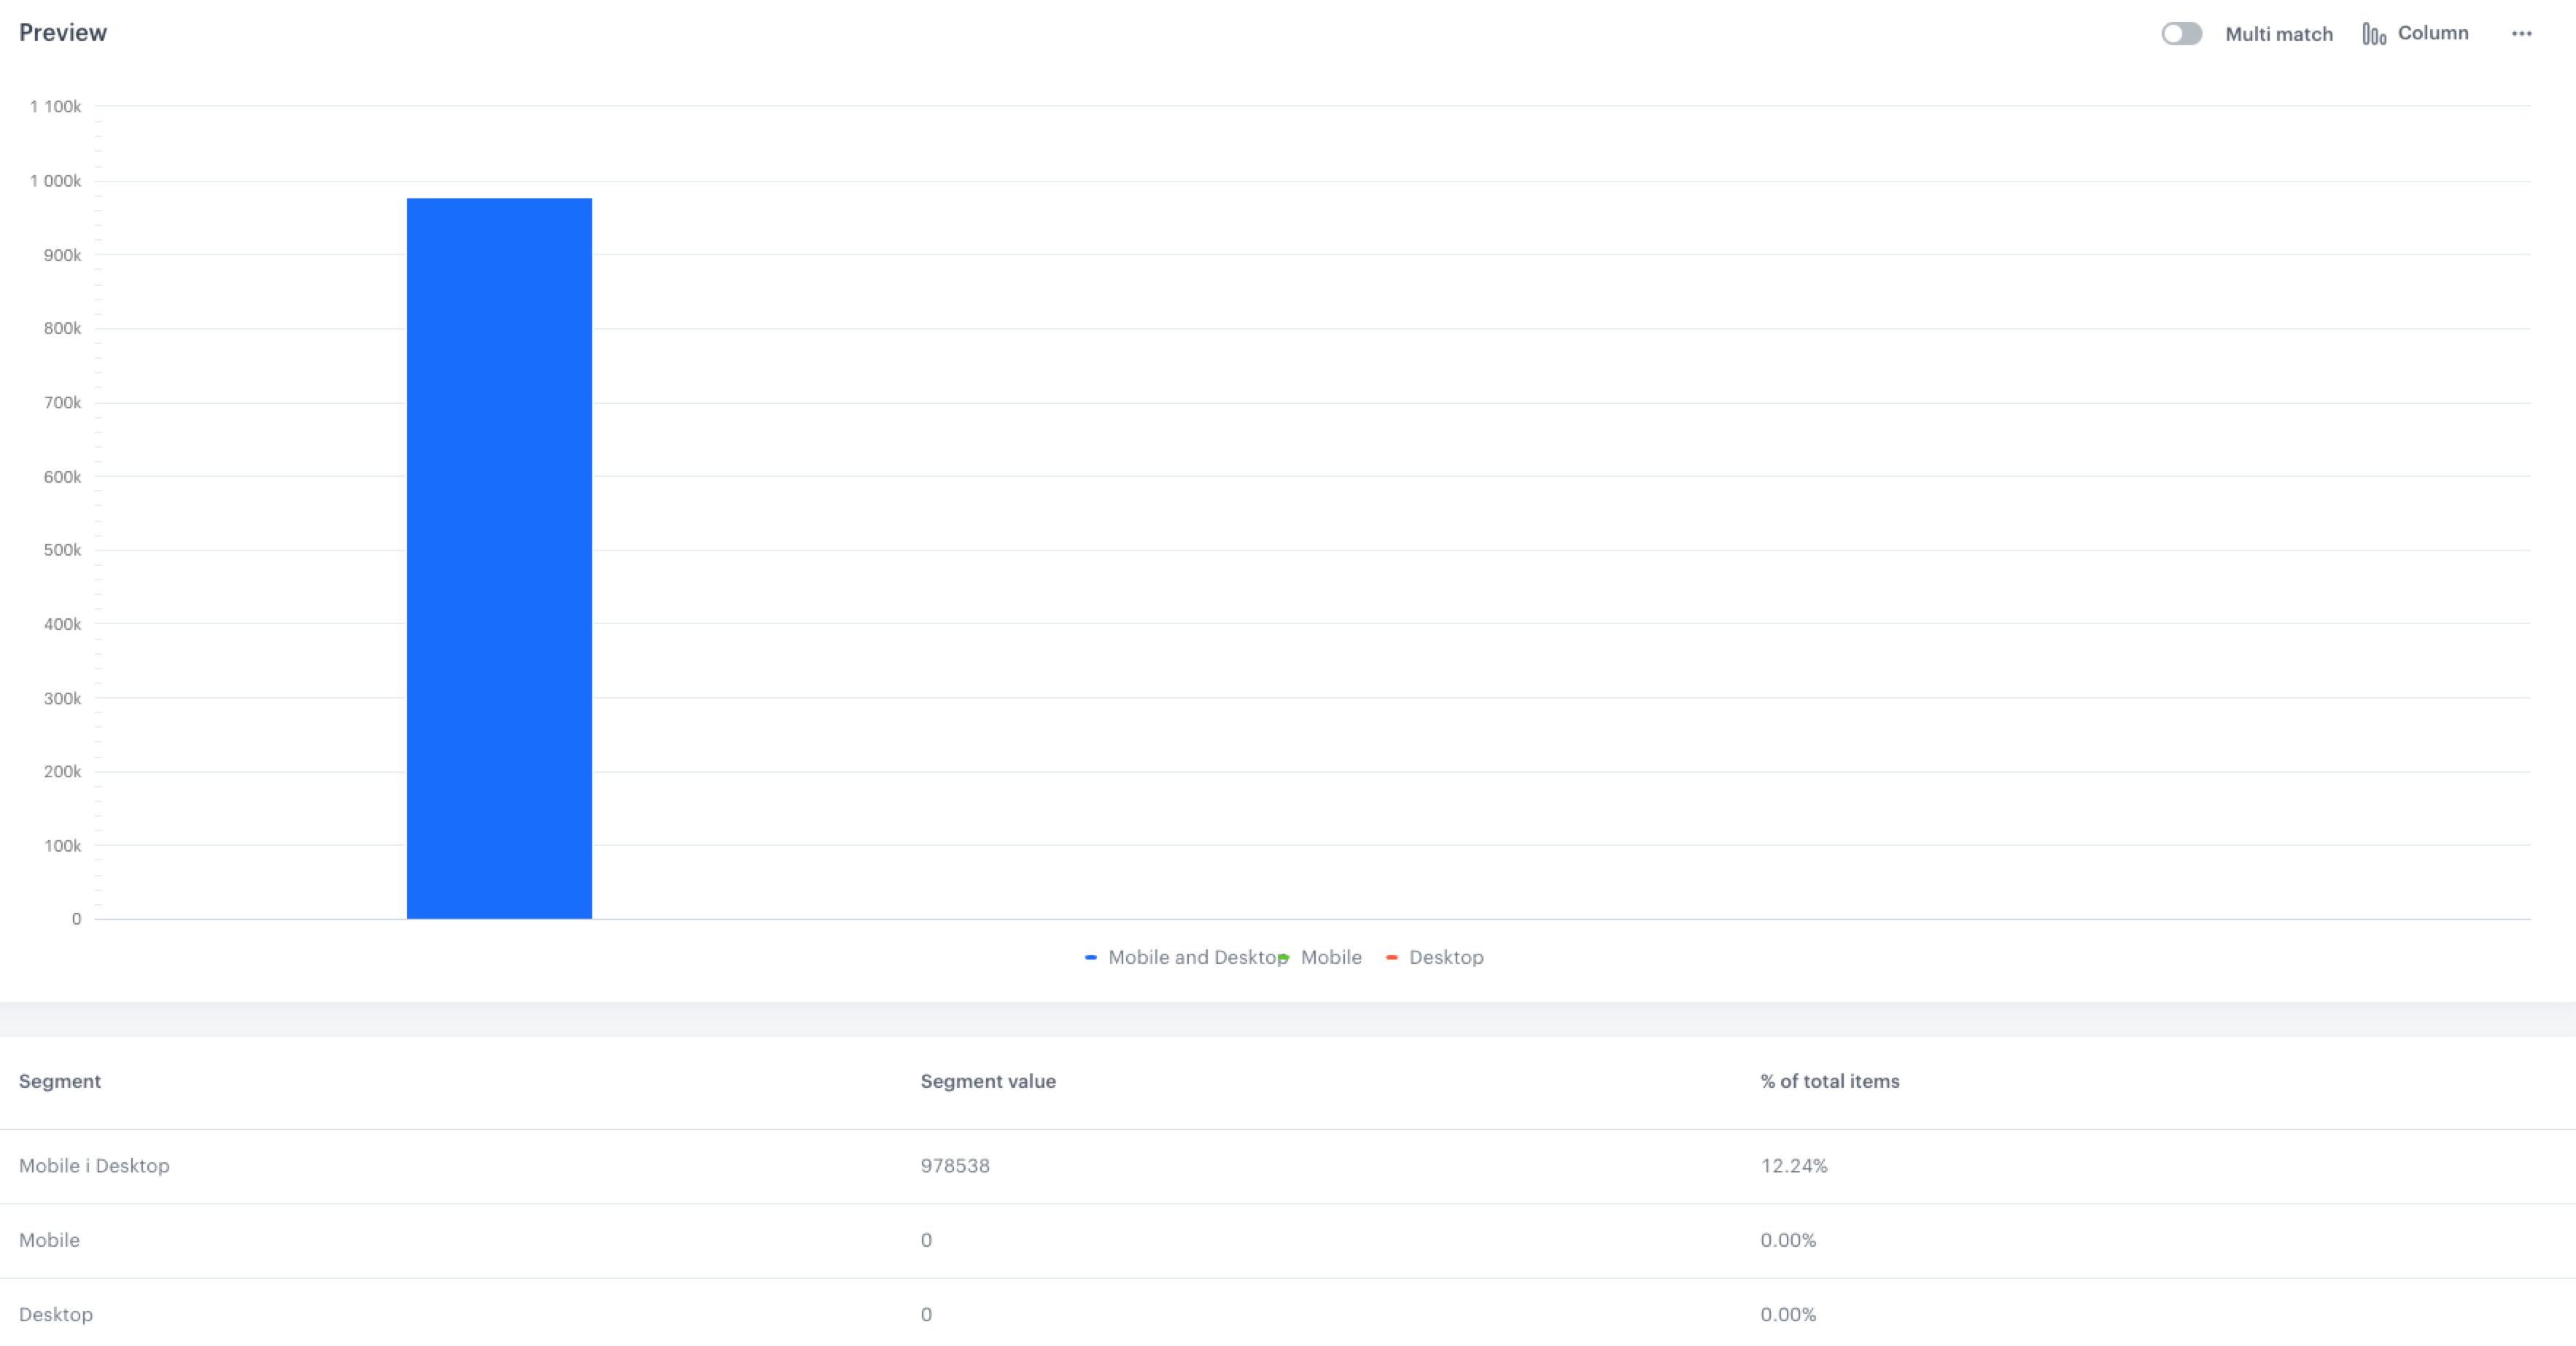
Preview segmentation
- Switch the Multi-match option on.
- Click Show preview.
You receive the number of customers in each segment and the percentage of each segment in relation to the whole population in the segmentation. Additionally:
- You can change the chart type - pie chart and column chart
- You can also export the information to CSV/XLSX (data) or JPEG/PNG/PDF (chart)
Check the use case set up on the Synerise Demo workspace
You can check the segmentation configuration directly in Synerise Demo workspace.
If you don’t have access to the Synerise Demo workspace, please leave your contact details in this form, and our representative will contact you shortly.