Connecting events within a profile
If two or more events have the same parameter, you can create relations between them by using aggregates.
Examples of use
-
Check if the discount code in a personalized promotion assigned to a user was used in a transaction.
-
Check the value of a transaction with a discount code or with a certain product.
-
Check if the product on a page promoted by a UTM campaign was added to the cart and then bought.
-
Check how many products added to a cart were not bought.
Procedure
Use case: A paid campaign promotes a certain set of products.
Goal: Check if the product on a page promoted by a UTM campaign was visited and then bought.
This procedure consists of the following steps:
- Create an aggregate that shows the image of the product from the page visited as a result of the campaign.
- Create a funnel using the aggregate with the product image that shows a list of customers who went through the
saw a product from a UTM campaign and then bought itpath.
Additionally, to make this analysis more complex: - Create a metric that measures the value of the purchased products from the campaign.
- Create an aggregate that measures the value of another
transaction.chargeevent.
Basic scenario
-
Go to
 Analytics > Aggregates > New aggregate.
 -
Enter the name of the aggregate.
-
By clicking the
 button, set First as the type of the aggregate result (this configures the aggregate to show the first value of the event parameter in the time range selected in the analysis).
 -
From the Choose event dropdown list, select the page.visit event.
-
From the Choose parameter dropdown list, select og:image.
-
Click the + where button.
-
From the Choose parameter dropdown list, select the utm_campaign.
-
Select the Equal logical operator.
-
Next to the logical operator, in the text field, enter the name of the UTM campaign.
-
By default, the date range for the analysis is set to the last 30 days. To change the date range, click the calendar icon. Confirm the changes with the Apply button.
-
Save the aggregate by clicking Save.
Result: The aggregate uses the image of the product and returns the first product viewed in the UTM campaign.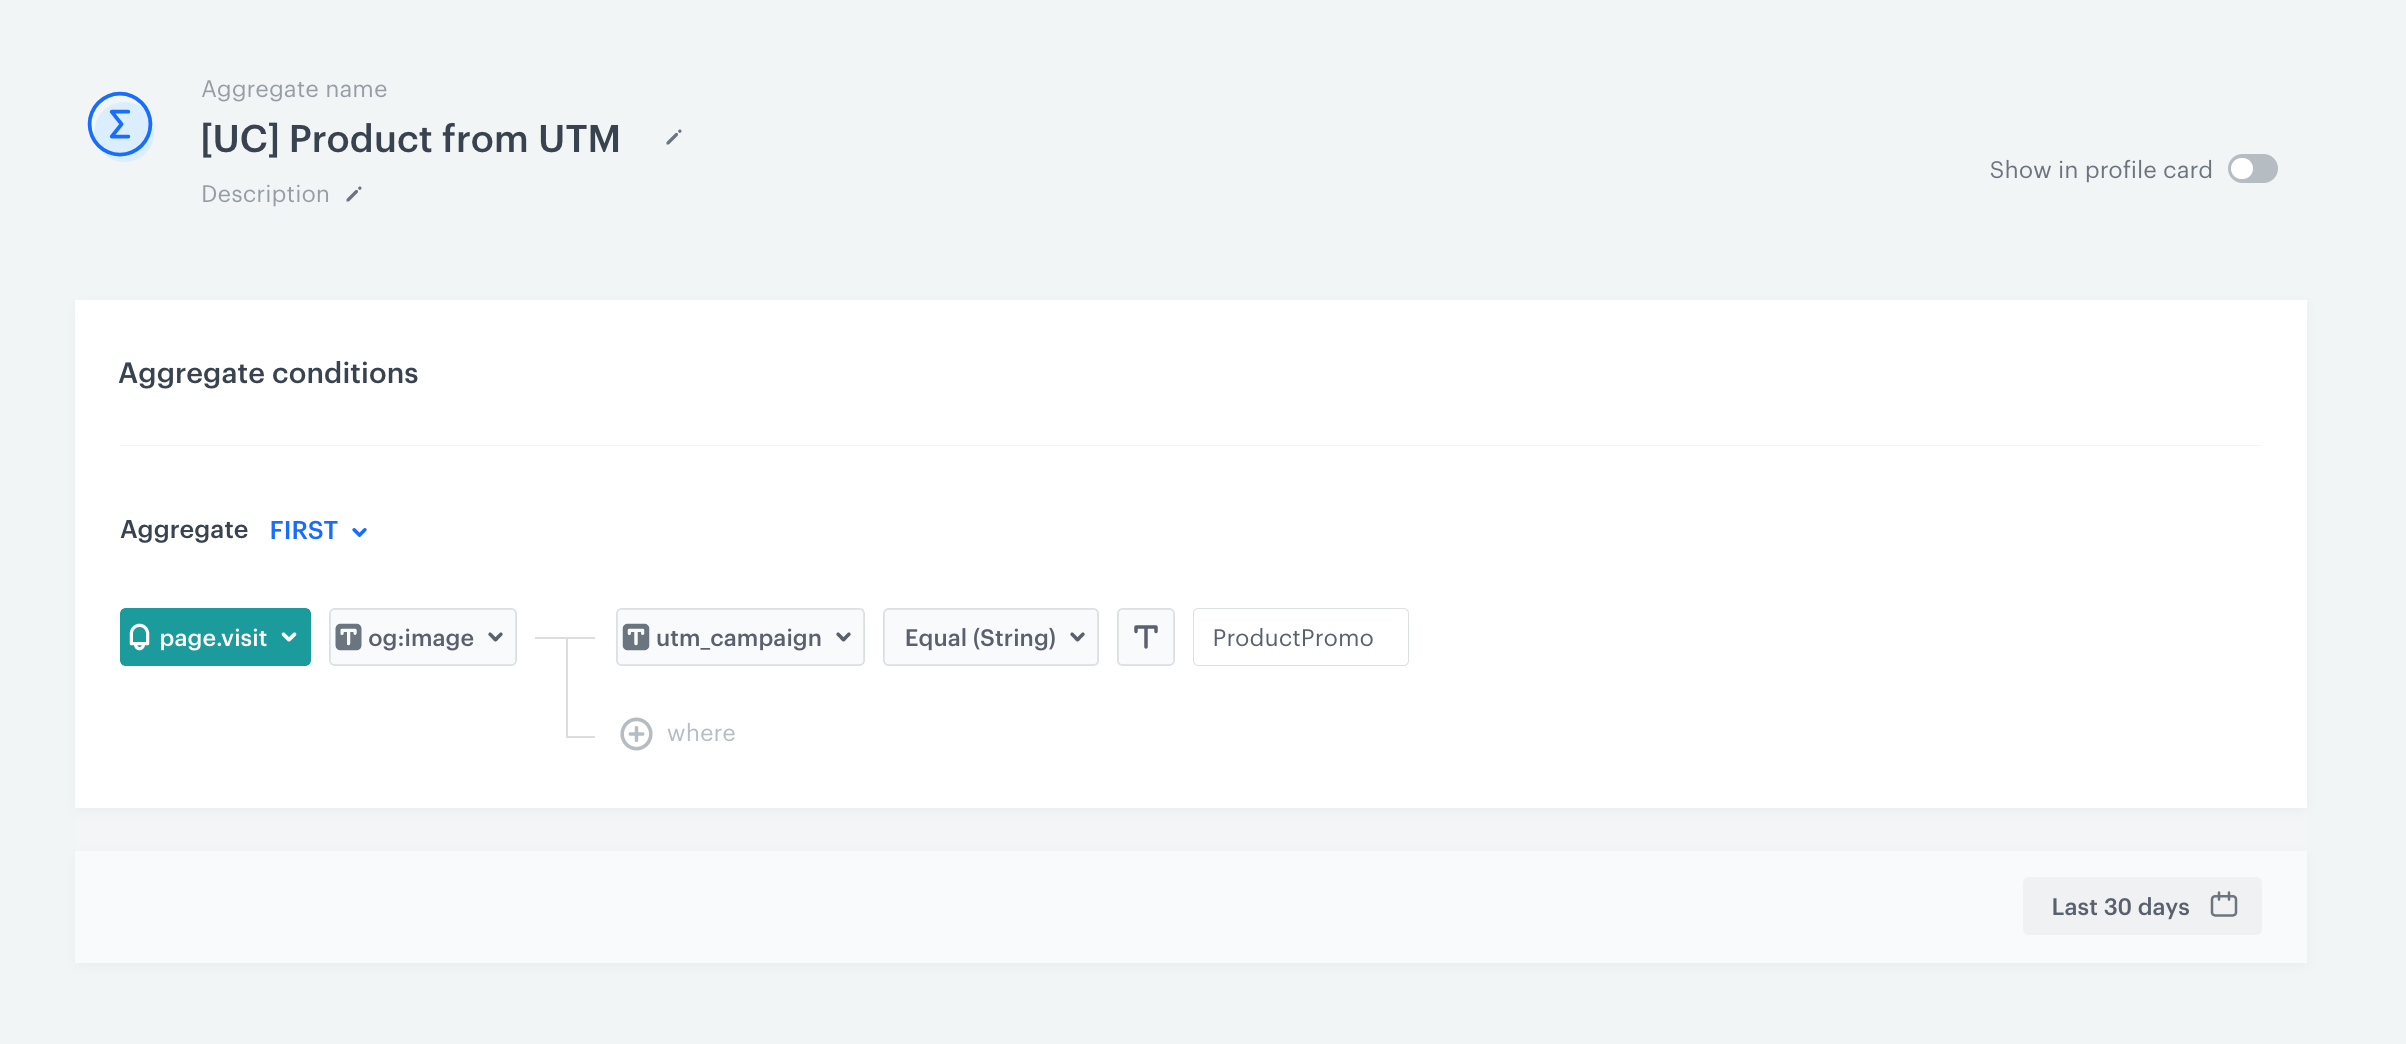
Filled settings of the aggregate -
Go to
Analytics > Segmentations > New segmentation. -
Enter the name of the segmentation.
-
From the Choose filter dropdown list, select the page.visit event.
-
Click + where button.
-
From the Choose parameter dropdown list, select the utm_campaign parameter.
-
Select the Equal logical operator.
-
Next to the logical operator, in the text field, enter the UTM campaign name.
-
Click Add funnel step.
-
From the Choose event dropdown list, select the Bought product event.
-
Click the + where button.
-
From the Choose parameter dropdown list, select $image.
-
Select the Equal logical operator.
-
Click the icon next to the logic operator and keep clicking until you get
 .
. -
From the Choose value dropdown list, click the
 icon, and then select Aggregates.
 -
Select the aggregate created in previous steps.
-
By default, the date range for the analysis is set at the last 30 days. To change the date range, click the calendar icon. Confirm the changes with the Apply button.
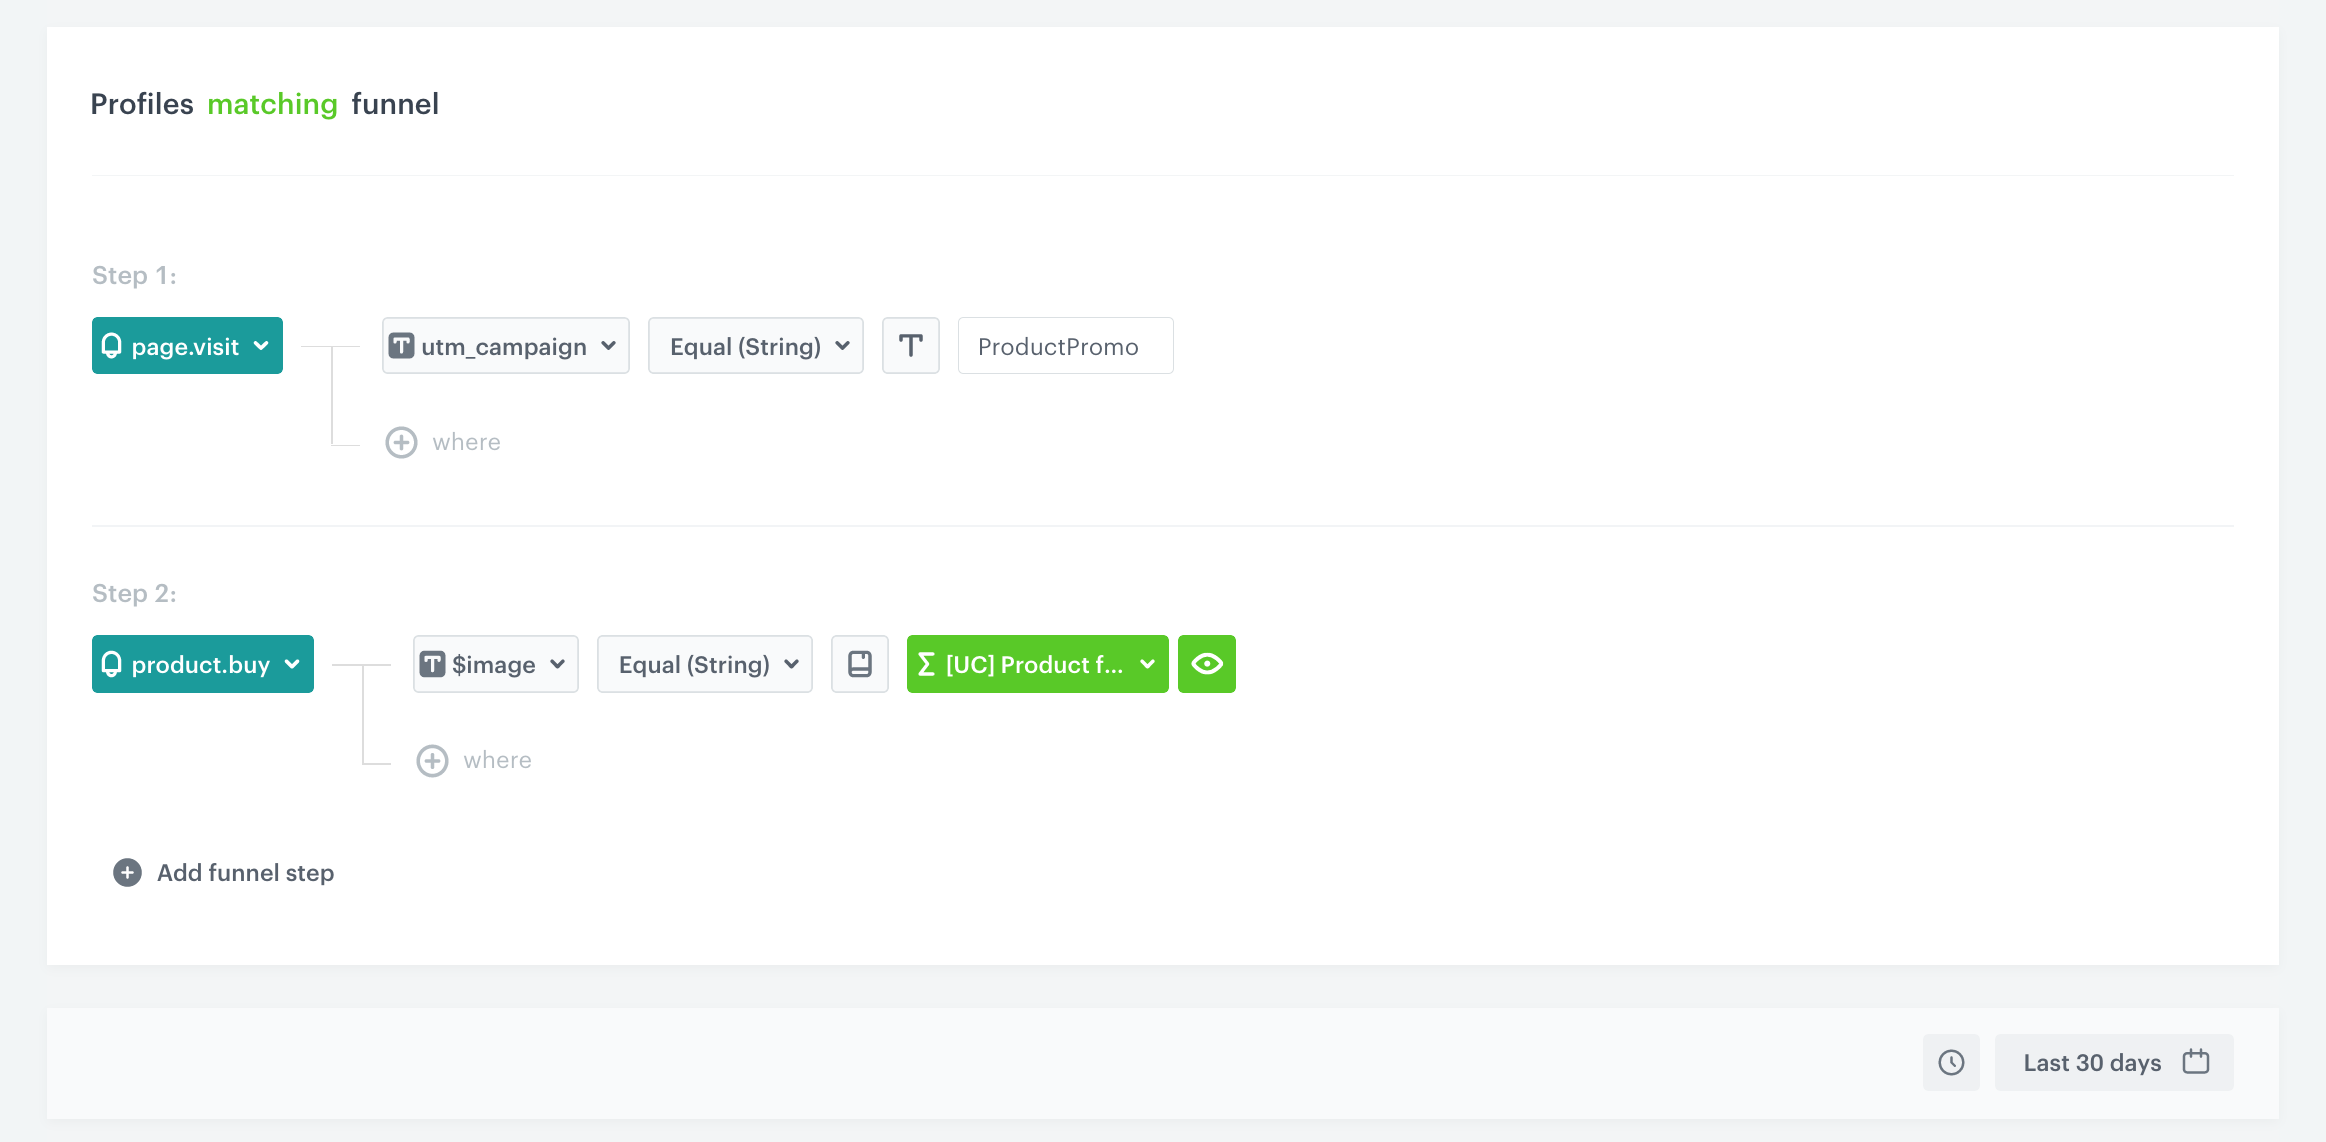
Filled settings of the funnel -
Save the segmentation.
Result: The results of the segmentation list customers who went through the saw a product from a UTM campaign and then bought it path.
Advanced scenario
Option 1
To measure the value of the purchased products from the campaign, you can create a metric that reuses the aggregates created in the Basic scenario. Before that, you must create an expression that calculates the price of purchased items.
- Go to Analytics > Expressions > New expression.
- Enter the name of the expression.
- Select the Event type of expression by clicking the icon.
- From the Choose event dropdown list, select the Bought product event.
- Start creating the formula of the expression by clicking the Select button.
Result: A dropdown list appears. - From the dropdown list, select Event attribute.
Result: The Unnamed event attribute appears. - Click the attribute.
- From the Choose parameter dropdown list, select $quantity.
- Click the plus button.
Result: Another event attribute appears. - Click the attribute.
- From the Choose parameter dropdown list, select $finalUnitPrice.
- Multiply those two attributes, by selecting the multiplication sign between two event attributes.
Result: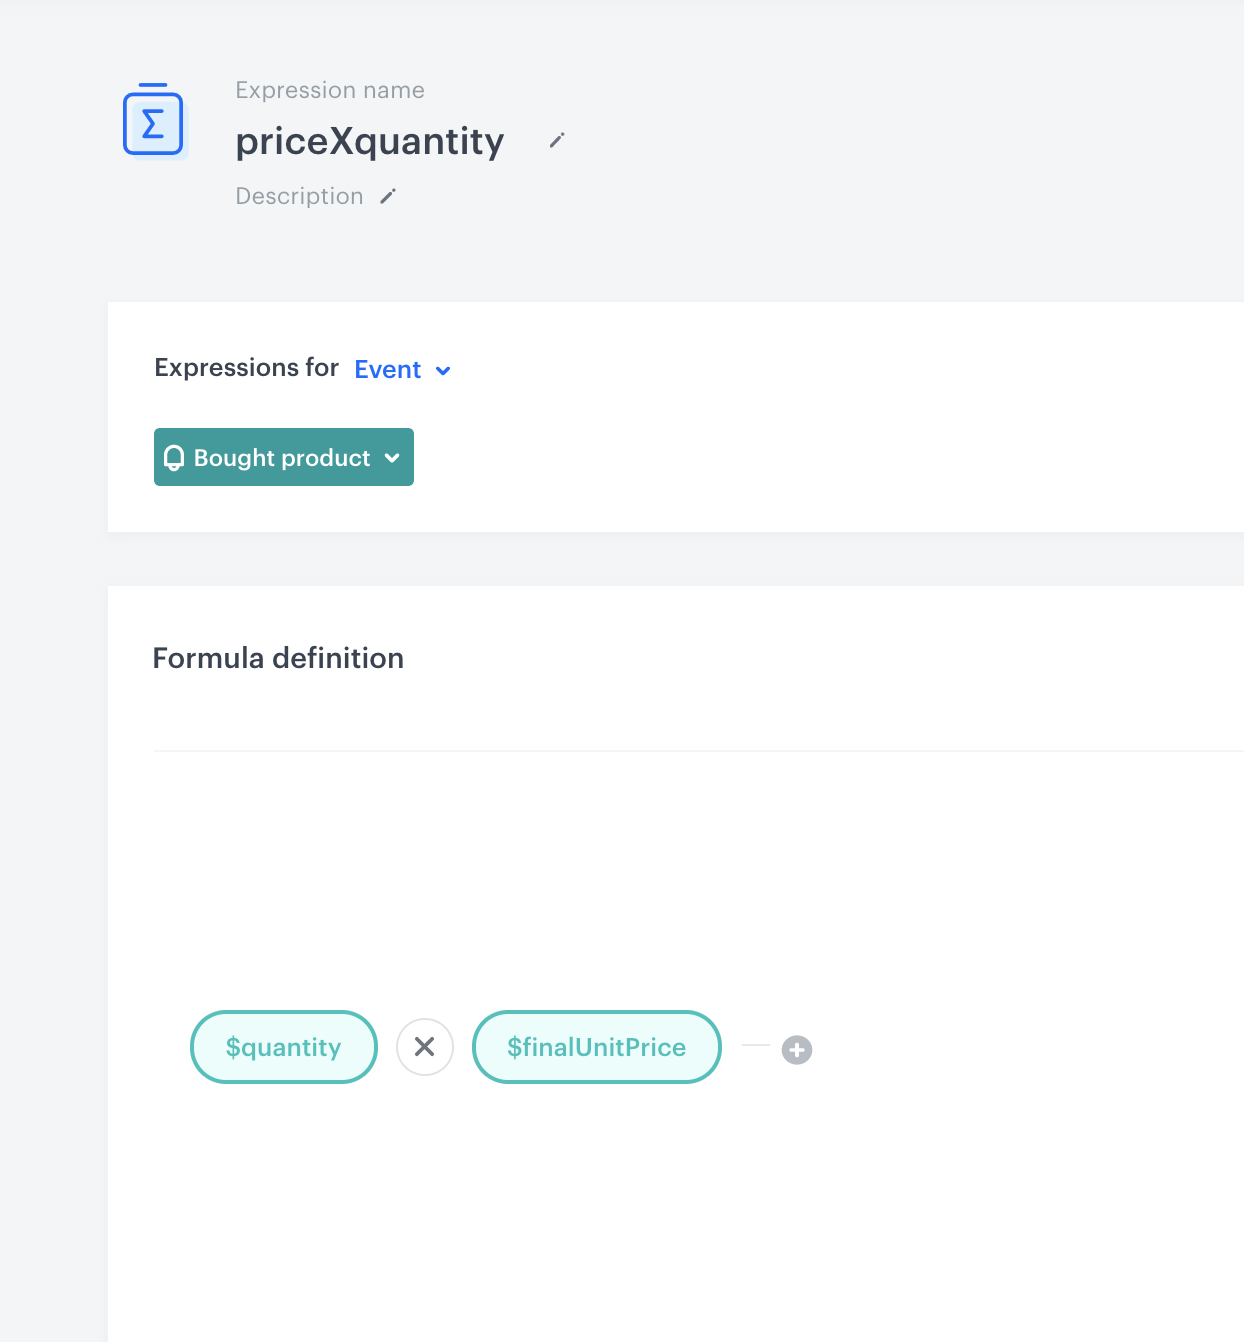
Expression that calculates the price of items - To save the expression, click Save.
- Go to Analytics > Metrics > New metric.
- Enter the name of the metric.
- From the Type dropdown list, select Event.
- From the Aggregator list, select Sum.
- From the Occurrence type, select All.
- From the Choose event dropdown, select Bought product
- From the Choose parameter dropdown list, click the icon, and then select Expression.
- Select the expression created in the previous steps.
- From the Choose parameter dropdown list, select $sku.
- As the logic operator, select In.
- Click the icon next to the logic operator and keep clicking until you get .
- From the Choose value dropdown list, click the icon, and then select Aggregates.
- Select the aggregate created in the previous steps.
Result: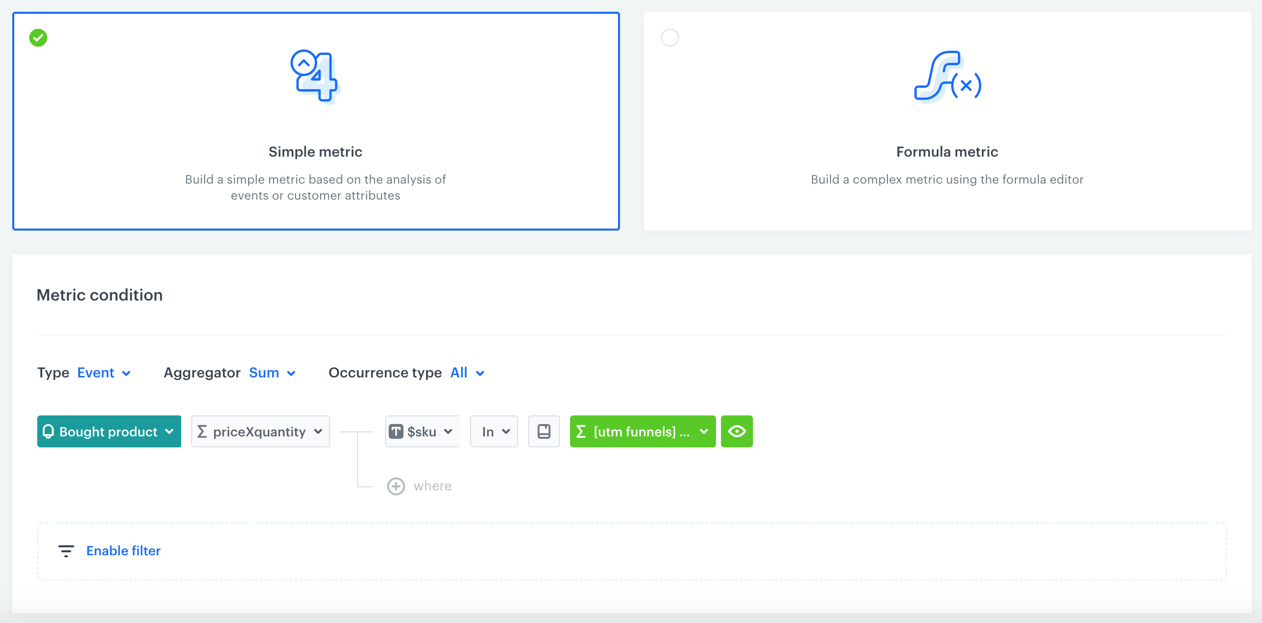
Filled settings of the metric
Result: The metric returns the total sum of purchased products from a specific UTM campaign within the defined time range. So far, the analyses in the Basic and Advanced procedures used two events and they have one parameter in common that connected them ($image).
Option 2
You can also measure the value of the transaction.charge event. You can do it by preparing a metric that contains three aggregates. The first one returns the first visited product from a particular UTM campaign. The second one returns a date when this product was visited. The third one returns a list of purchased items a specified UTM campaign by using the two previous aggregates.
First aggregate
- Go to Analytics > Aggregates > New aggregate.
- Enter the name of the aggregate.
- By clicking the button, set First as the type of the aggregate result (then the aggregate result shows the first value of the event parameter in the time range selected in the analysis).
- From the Choose event dropdown list, select the page.visit event.
- From the Choose parameter dropdown list, select the og:image.
- Click the + where button.
- From the Choose parameter dropdown list, select utm_campaign.
- Select the Equal logical operator.
- Click the icon next to the logic operator and keep clicking until you get
 .
. - In the left text field, enter the name of the dynamic key (in this case, it’s
utm_campaign). - In the right text field, enter the value of the dynamic key (name of the UTM campaign).
Tip:You can find the name of the UTM campaign in the following places:
- In the summary of the message (Communication > Email. Click the message to get to the details, find the UTM&URL parameters section)
- In the template code (for the automated emails)
- In the details of an event (for example, newsletter.click) in the activity list on a profile
- In the link used in the email (click the link in the email, the URL contains the name of the UTM campaign)
- By default, the date range for the analysis is set at the last 30 days. To change the date range, click the calendar icon. Confirm the changes with the Apply button.
- Save the aggregate by clicking Save.
Result: The aggregate returns the first visited product from a specific UTM campaign.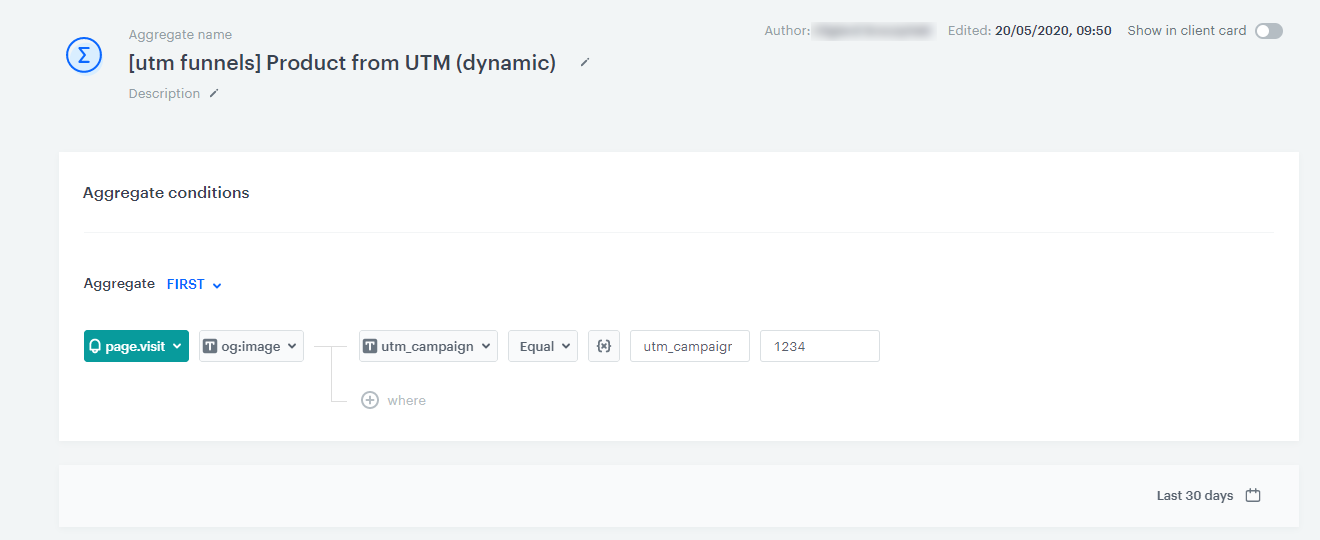
Filled settings of the aggregate
Second aggregate
- Go to Analytics > Aggregates > New aggregate.
- Enter the name of the aggregate.
- By clicking the button, set First as the type of the aggregate result (this configures the aggregate to show the first value of the event parameter in the time range selected in the analysis).
- From the Choose event dropdown list, select the page.visit event.
- From the Choose parameter dropdown list, click the icon, and then select Specials.
- From the list, select TIMESTAMP.
- Click the + where button.
- From the Choose parameter dropdown list, select utm_campaign.
- Select the Equal logical operator.
- Click the icon next to the logic operator and keep clicking until you get .
- In the left text field, enter the name of the dynamic key (in this case, it’s
utm_campaign). - In the right text field, enter the value of the dynamic key.
Tip:
You can find the name of the UTM campaign in the following places:
- In the summary of the message (Communication > Email. Click the message to get to the details, find the UTM&URL parameters section)
- In the template code (for the automated emails)
- In the details of an event (for example, newsletter.click) in the activity list on a profile
- In the link used in the email (click the link in the email, the URL contains the name of the UTM campaign)
- By default, the date range for the analysis is set at the last 30 days. To change the date range, click the calendar icon. Confirm the changes with the Apply button.
- Save the aggregate by clicking Save.
Result: The aggregate returns the date of the first visit to the product from the selected UTM campaign.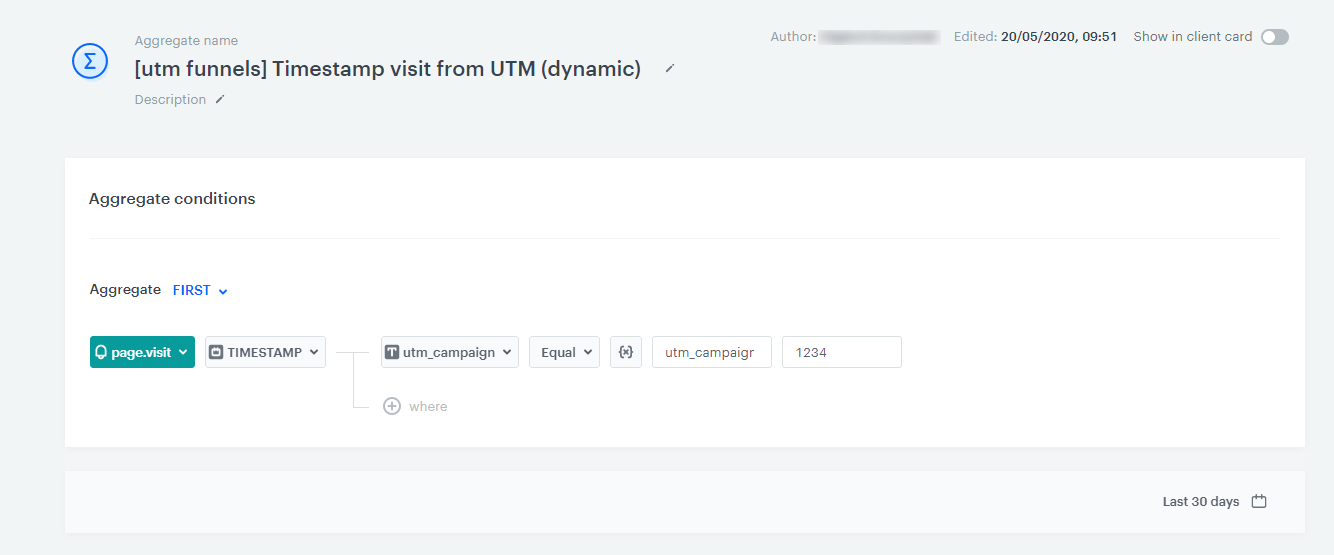
Filled settings of the aggregate
Third aggregate
- Go to Analytics > Aggregates > New aggregate.
- Enter the name of the aggregate.
- By clicking the button, set Last Multi as the type of the aggregate result (this configures the aggregate to show the defined number of results of the event parameter in the time range selected in the analysis).
- In the Size field, select the number of results of the aggregate.
- From the Choose event dropdown list, select the product.buy event.
- From the Choose parameter dropdown list, select $orderId.
- Click the + where button.
- From the Choose parameter dropdown list, select $image.
- Select the Equal logical operator.
- Click the icon next to the logic operator and keep clicking until you get .
- From the Choose value dropdown list, click the icon, and then select Aggregates.
- Select the first aggregate created in the previous steps.
- Click the + where button.
- From the Choose parameter dropdown list, select $image.
- Select the Equal logical operator.
- Click the icon next to the logic operator and keep clicking until you get .
- From the Choose value dropdown list, click the icon, and then select Aggregates.
- Select the second aggregate created in previous steps.
- Save the aggregate by clicking Save.
Result: The aggregate returns a list of products (the number of products depend on the value entered in the Size field, in the step 4) from the selected UTM campaign.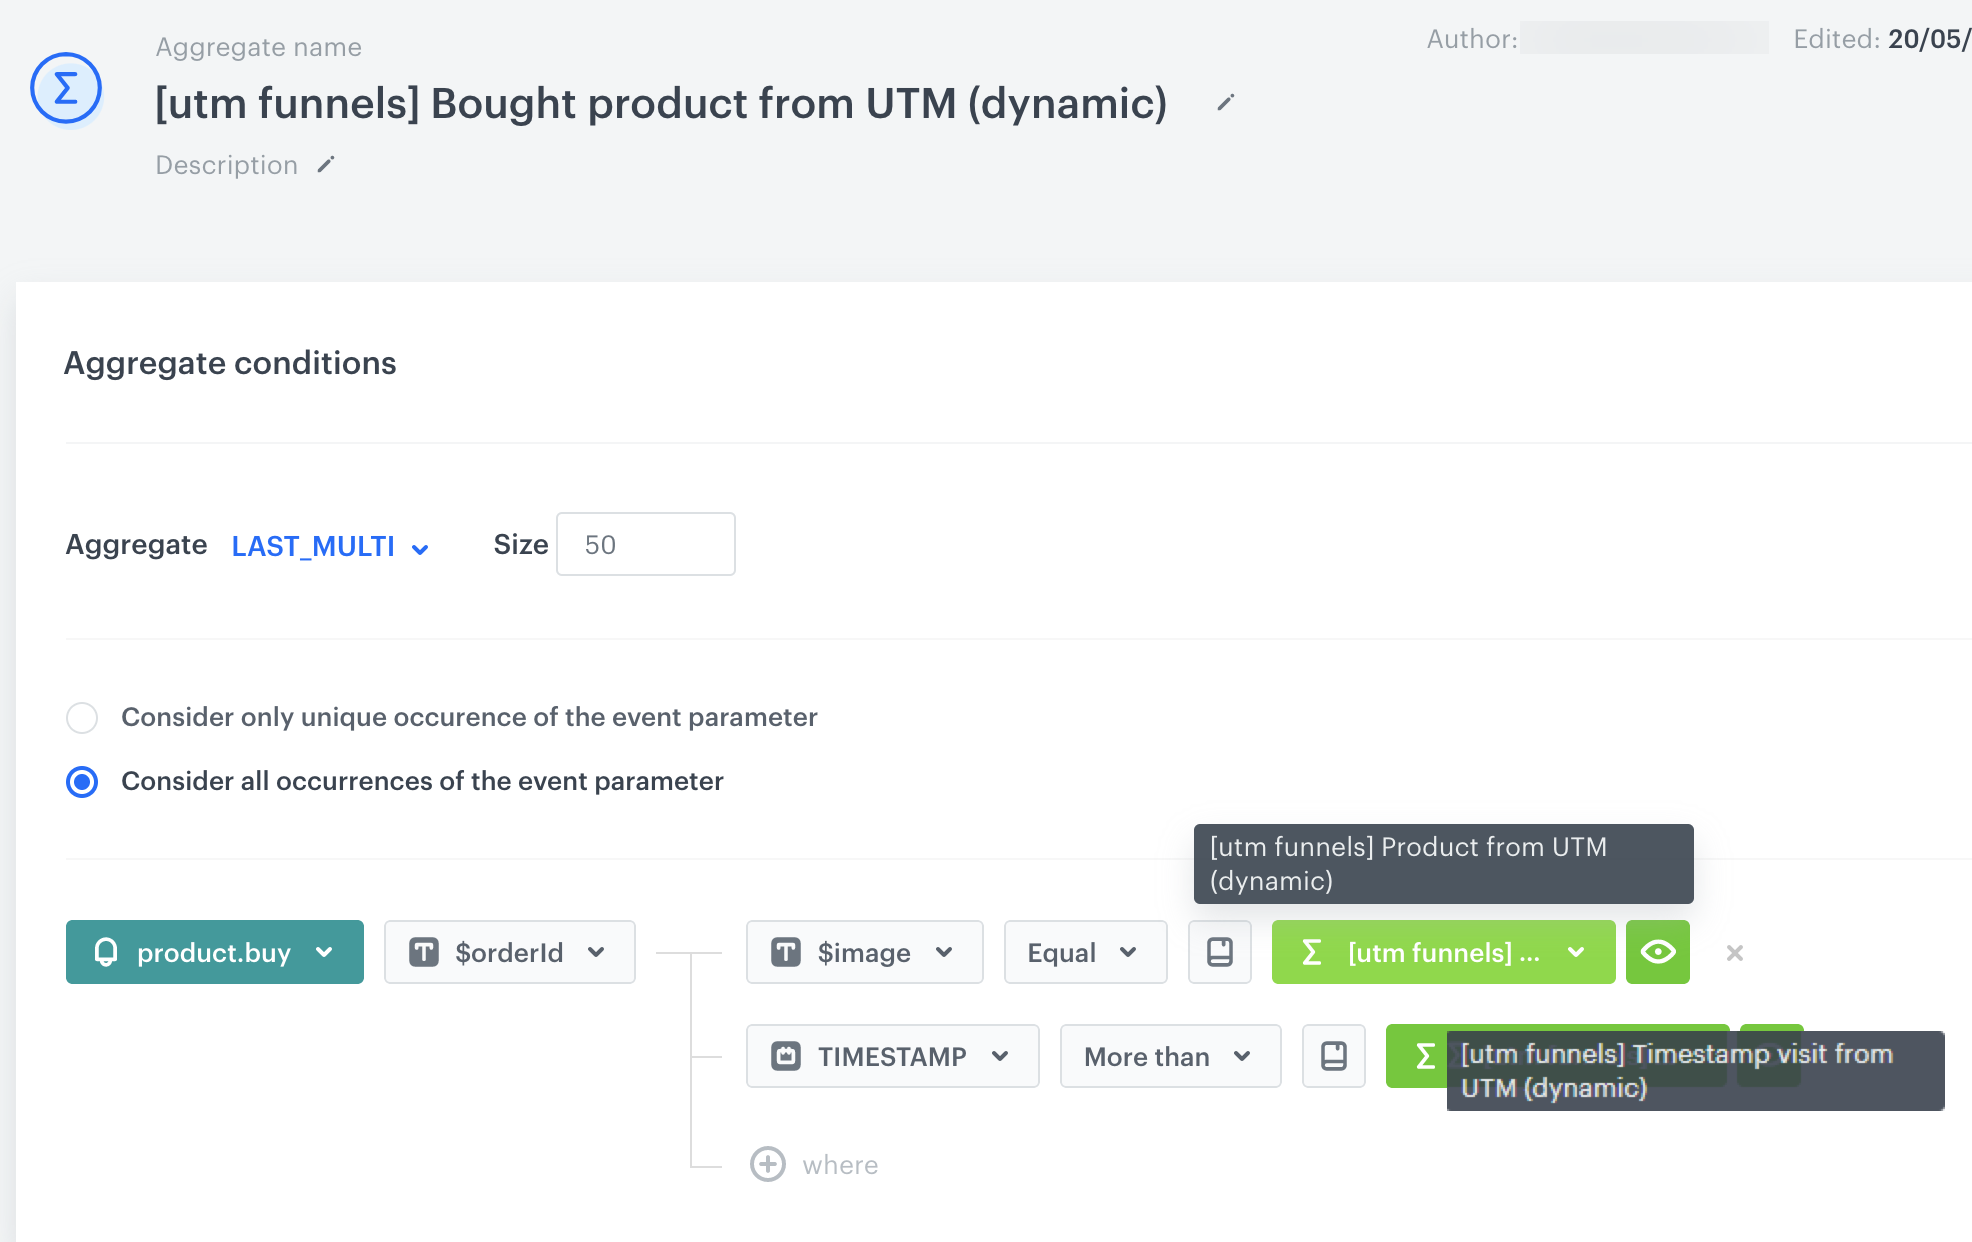
Filled settings of the aggregate
Metric
- Go to Analytics > Metrics > New metric.
- Enter the name of the metric.
- Select a simple metric (set by default).
- As the Type, select Event (set by default).
- As the Aggregator, select Sum.
- As the Occurrence, select All.
- From the Choose event dropdown list, select transaction.charge.
- Click the + where button.
- From the Choose parameter dropdown list, select $totalAmount.
- Click the + where button.
- From the Choose parameter dropdown list, click the icon, and then select Specials.
- From the list, select TIMESTAMP.
- As the logical operator, select More than.
- Click the icon next to the logic operator and keep clicking until you get .
- From the Choose value dropdown list, click the icon, and then select Aggregates.
- Select the third aggregate.
- Click the + where button.
- From the Choose parameter dropdown list, select $orderId.
- As the logical operator, select In.
- Click the icon next to the logic operator and keep clicking until you get .
- From the Choose value dropdown list, click the icon, and then select Aggregates.
- Select the third aggregate.
- Save the metric.
Result: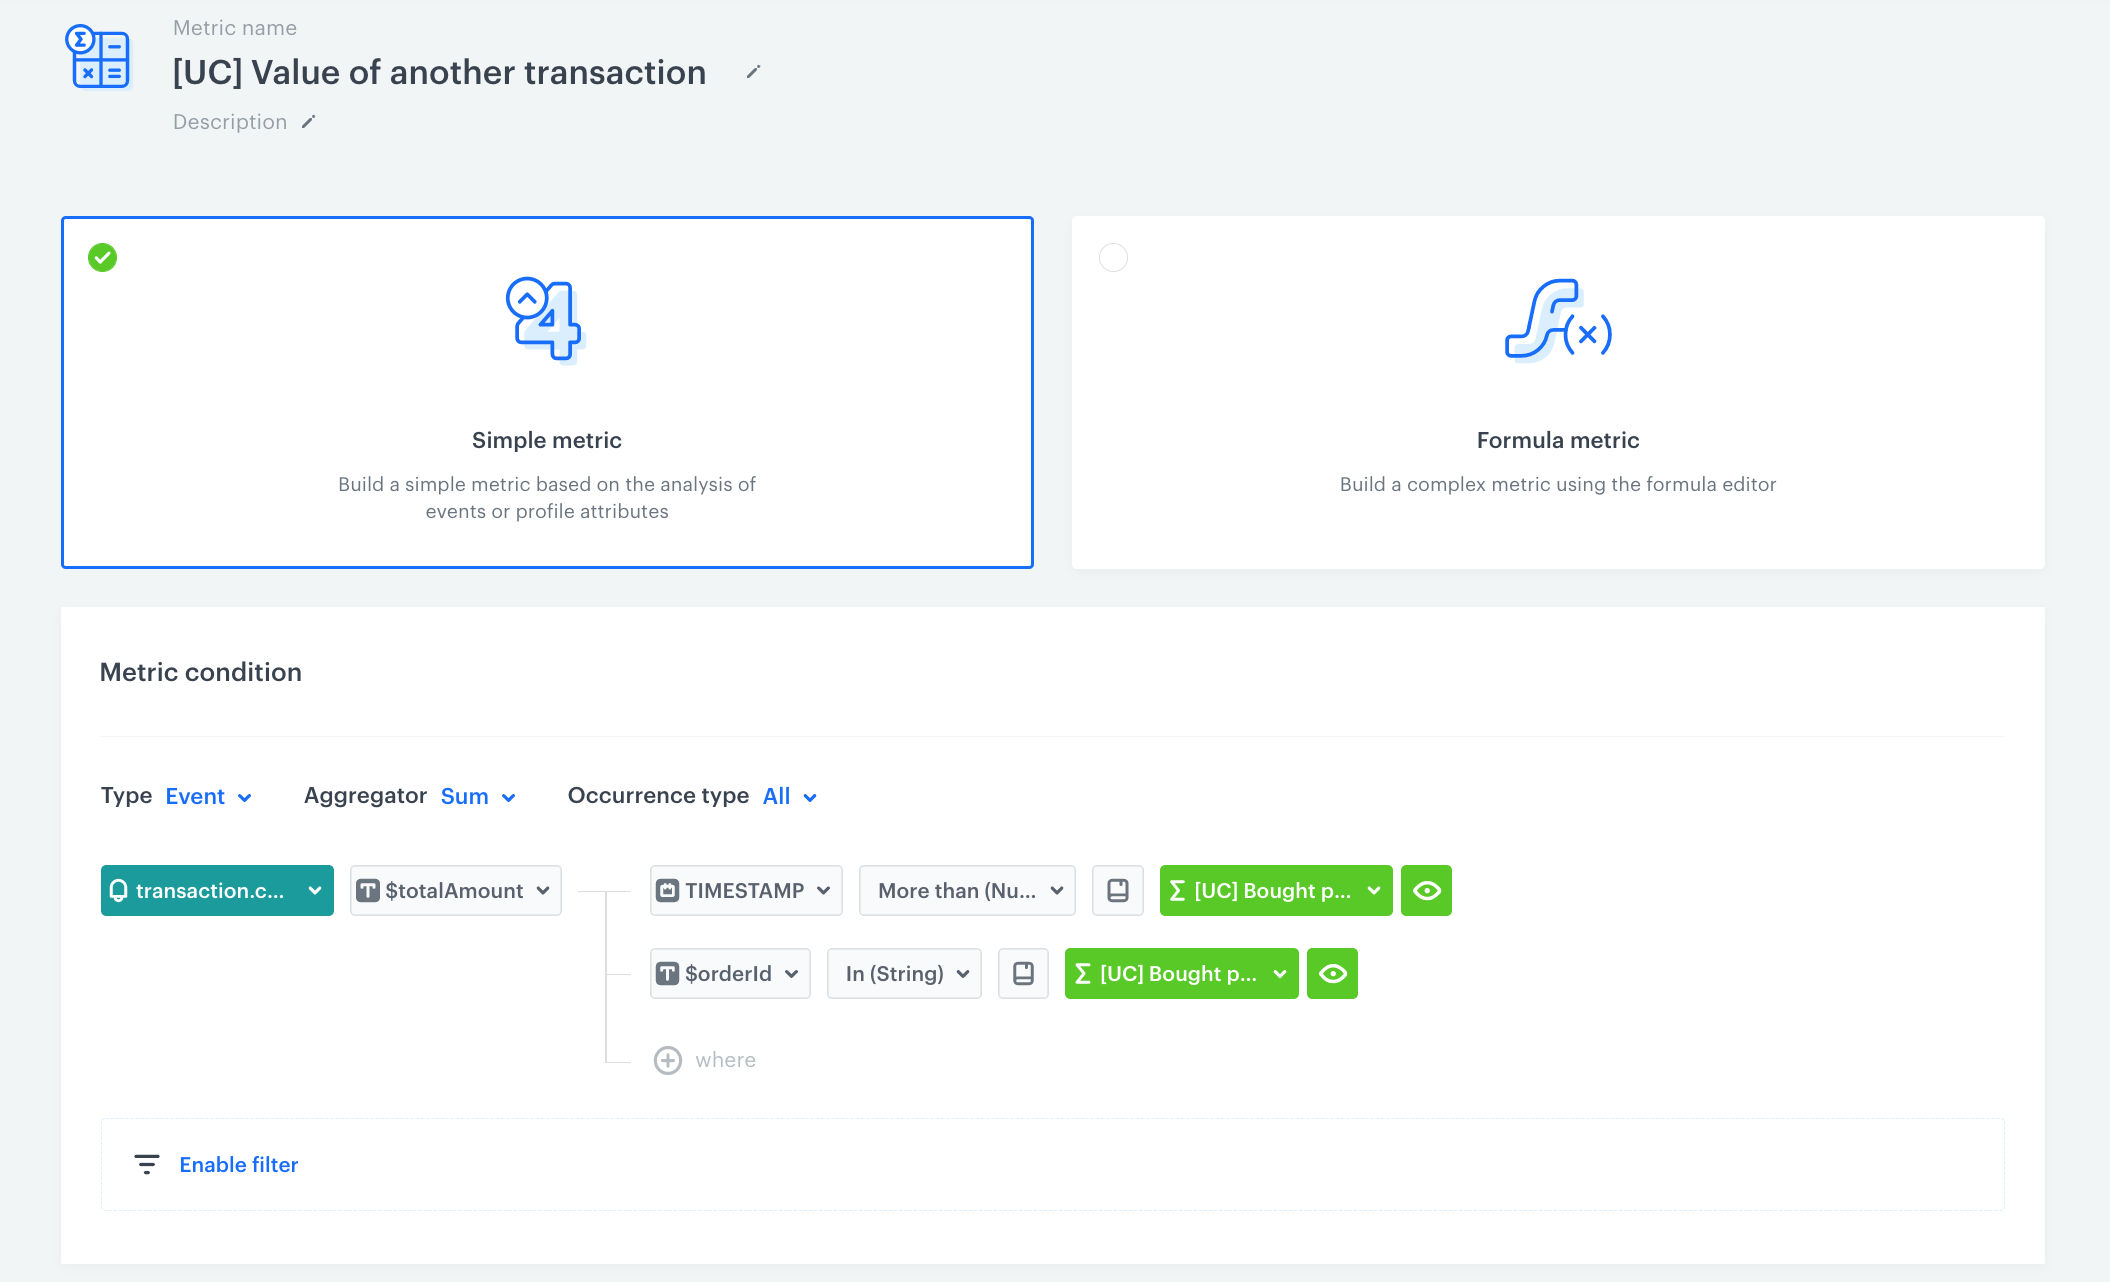
Filled settings of the metric
content/en