Creating simple metrics
To prepare a simple analysis of events or customers, you need to create a simple metric. The metric results are presented as a numerical value.
Requirements
A tracking code implemented into your website.
Creating a simple metric
-
Go to
 Analytics > Metrics > New metric.
 -
Enter the name of the metric.
-
Optionally, to let other users know about the purpose of the metric, you can write a short description.
-
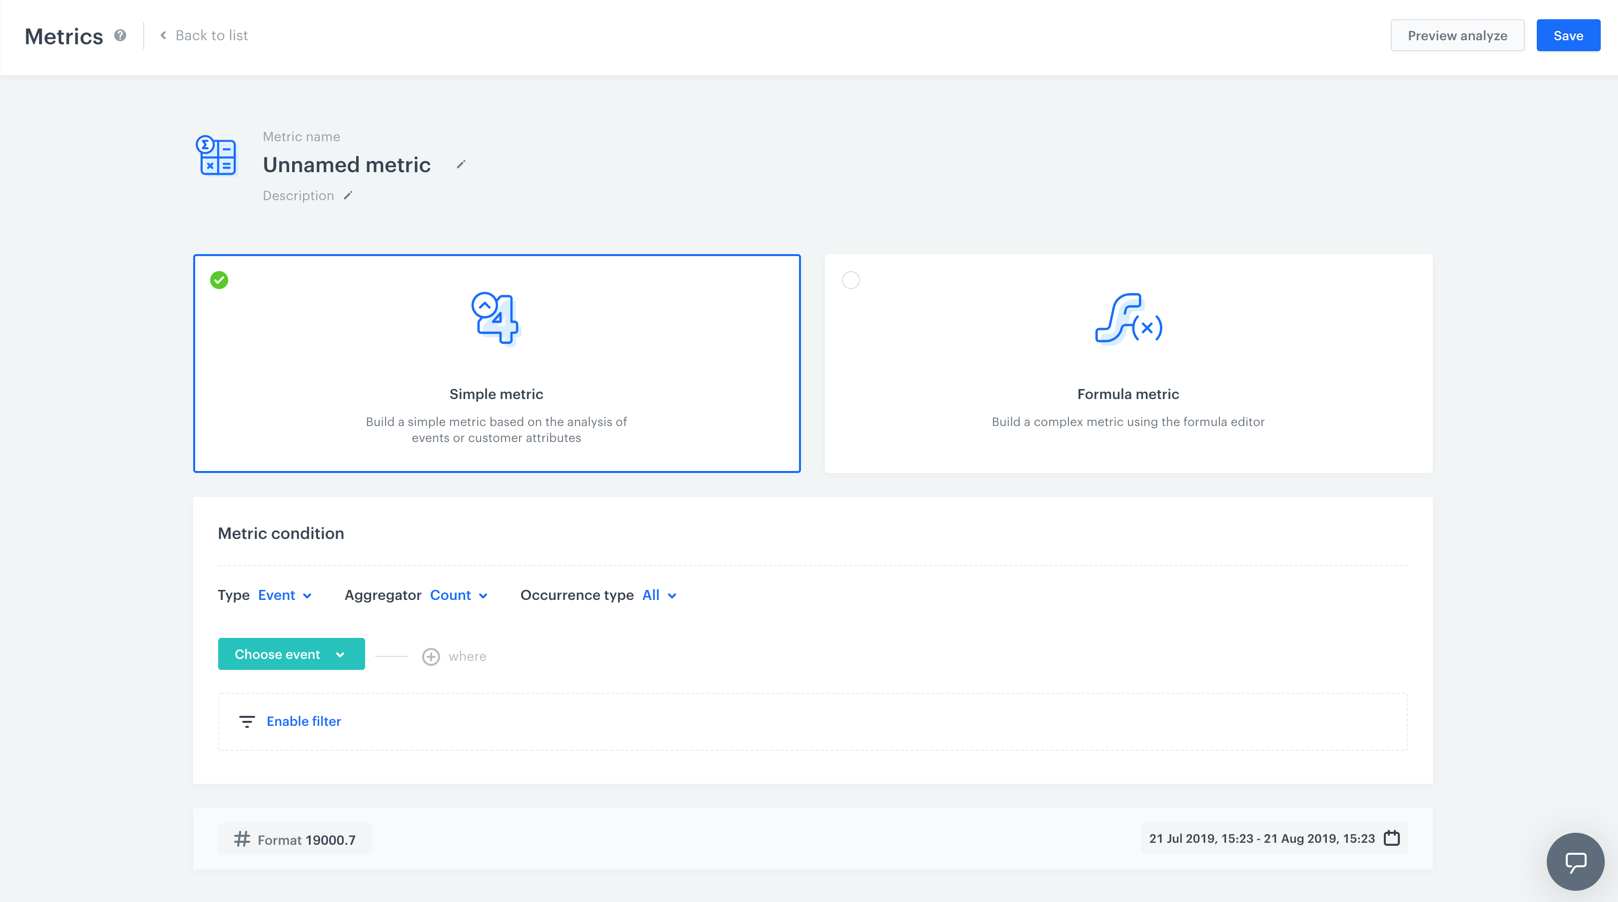
Choose Simple metric.
-
To choose the context of data analyzed in the metric, next to the Type option, click the arrow. You can analyze events or customers.
-
To choose the type of results, next to the Aggregator option, click the arrow.
Agregators
Available aggregator types:
Note: The aggregator types are explained on the example of the event metric type. You can also use these aggregators for the profile metric type.- Exists - The result of a metric informs you whether a chosen event has occurred in the time range selected in the analysis. The result of the metric returns boolean.
- Sum - The result of the metric returns the total value of the event parameter in the time range selected in the analysis.
- Min - The result of the metric returns the minimal value of the event parameter in the time range selected in the analysis.
- Median - The result of the metric returns the value separating the higher half from the lower half. For example, if you want to examine the total value of purchases, the result of the metric returns the middle value of the amount of money customers spent.
- Quantile - The result of the metric is the value of the characteristics of the studied population, which divide the ordered statistical population into specific, equal parts in terms of the number of statistical units. For example, if you examine the total value of purchases and you select the
0.8quantile, the result of the metric will show you the value above which 20% of the results are higher than the number the metric returned, and the rest of them is lower than the number the metric returned.
Note: Check out the use case that describes process of finding heavy buyers with declining purchase activity in which a quantile aggregator is used in the metric. - Max - The result of the metrics returns the maximal value of the event parameter in the time range selected in the analysis.
- Average - The result of the metric returns the average value of the event parameter in the time range selected in the analysis.
- Count - The result of the metric returns the number of event occurrences in the time range selected in the analysis.
- Count Distinct - The result of the metric returns the number of unique occurrences of an event in the time range selected in the analysis.
Note: You can check the use case that calculates the percentage of unique transactions where the metric in which the Count Distinct aggregator is used.
-
To define the type of occurrence, next to the option Occurrence type, click the arrow. This way you can count the first, the last or all occurrences of a chosen event.
This option is available only for the metric that are based on events. -
From the dropdown list, select an event (or an attribute). Customers who performed a specific action (that triggers the selected event) are considered in the analysis. To define the details of the event, perform one or two actions described below:
- If you want to narrow down the scope of customers, click the Enable filter option. This profile filter works as an additional condition a customer has to meet in order to be counted in the metric.
- If you want to be more specific and analyze a particular aspect of the event, select event parameters by clicking the Where button.
-
To determine the time range from which the data is analyzed, click the calendar. Confirm your choice with the Apply button.
-
Optionally, you can preview the results, before you save the metric. To see the metric preview, click the Preview analyze button. If you want to go back from preview to editing mode, click the Edit Condition button.
-
To complete the process, click the Save button.