Creating Sankey Diagrams
Sankey Diagrams in Synerise allow the users to reconstruct the flow of customer actions before or after an occurrence of a particular event. Using an event as a reference point, users create charts that present steps to get the answers to questions such as “how much?” and “how is it connected with each other?”.
Requirements
To collect the events on your website, you need to paste the tracking code into the source of your website.
Creating a Sankey Diagram
- Go to
 Analytics > Sankey Diagrams > New sankey.
 - Give a name to your analysis.
- Optionally, to let other users know what’s the objective of the analysis, you can write a short description.
- Choose the number of steps you want to analyze. To do so, click the
 and choose a number from the dropdown list.
 - Choose the number of paths that come from each step. To do so, click the and choose a number from the dropdown list.
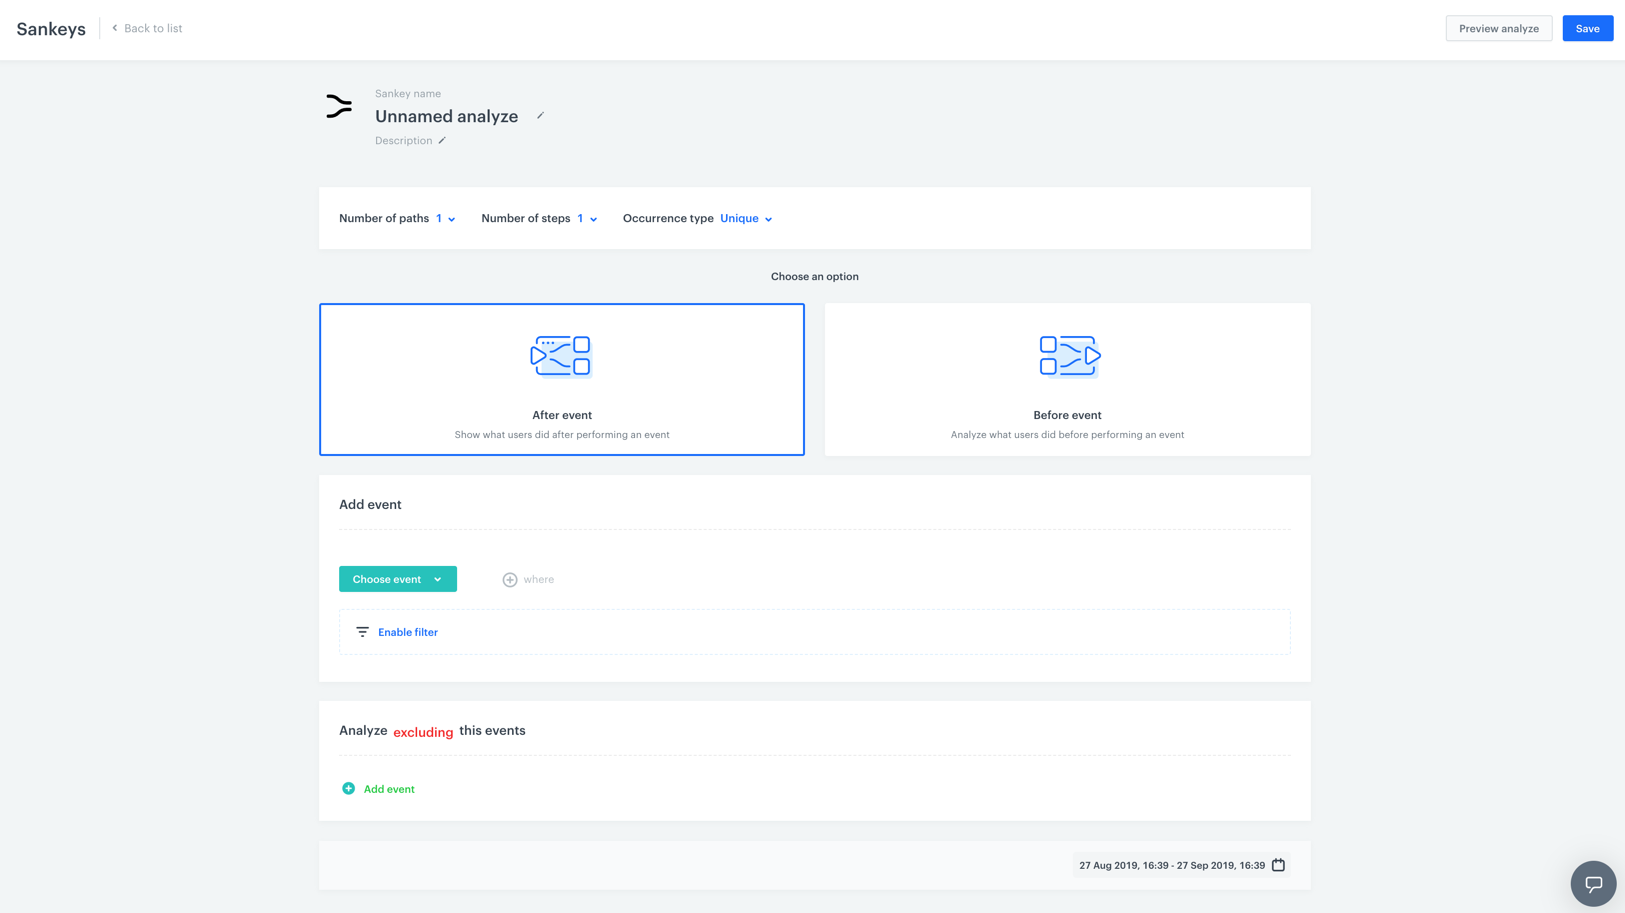
- Define the type of event occurrences.
- Unique occurrences - It means that only the first occurrence of the event is counted in the analysis. Every subsequent occurrence of the same event will be ignored in the analysis. This way you can count the number of customers who are in the flow.
- All occurrences - It means that if a customer repeated a series of actions, each of them will be counted in the analysis. This way you can count the number of the flow repetitions.
- By selecting one of two following options, choose the reference point of the analysis:
- After event - The system will analyze the flow of customers’ actions after the occurrence of a particular event.
- Before event - The system will analyze the flow of customers’ actions before the occurrence of a particular event.
- Choose an event that is the basis of the analysis. Depending on the option you have selected in step 4, the system generates a chart with the customer actions before or after the event you choose.
- To narrow down the scope of the analyzed event, click the Enable filter button. Confirm the settings in the filter by clicking the Apply button.
- If you want to exclude the occurrence of particular events from the analysis, click the Add event button. These events will not be considered in the analysis at all.
- To define the time range for data analysis, click the calendar icon. Confirm the dates by clicking the Apply button.
- To complete the process, click the Save button. When you save the chart, you can find it on the list of the Sankey charts.