Statistics and tracking automation events
You can preview the statistics of your activated, paused, and finished workflows to evaluate their effectiveness, but statistics are also useful for troubleshooting. Additionally, each node includes the Show in Profiles option, which allows you to view a list of profiles who reached the node.
automation.clientStartPath, automation.clientEndPath, and automation.clientPathStep events. If a profile generated the event further in the past than the retention period, the profile is not included in the list.This is because the profile list is retrieved from the Analytics engine each time. Numerical stats (such as how many profiles entered a node) are stored separately and not affected by retention.
The statistics are available for each node of the workflow and the scope of basic information includes how many profiles in a workflow reached and left the node. The full statistics reference is available here.
Workflow statistics
-
To access the statistics, go to
 Automation > Workflows.
 -
On the workflow list, click the workflow you want to see the details of.
-
To preview the node statistics, hover the mouse cursor over the statistic widget marked on the screen below.
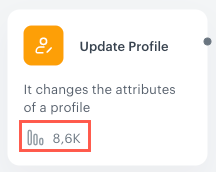
The statistics widget -
To preview the list of profiles who reached the node, on the node, click the
 icon.
icon. -
From the dropdown list, select Show in Profiles.
-
In the modal that appears, click Show in Profiles.
Result: The Profile list opens in a new tab.
Statistics reference
The table below contains all statistics you can encounter in the nodes.
| Statistics | Description |
|---|---|
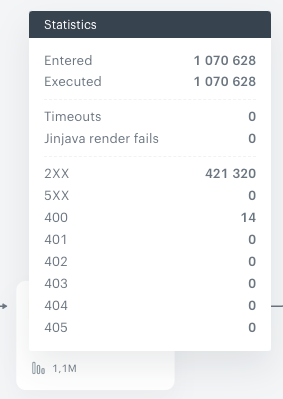
| Entered | the number of profiles who arrived at the node |
| Executed | the number of profiles who proceeded to the next node |
| Pending | the number of profiles who are currently waiting in the node to meet the conditions of the node (for example, in the Delay node waiting for the period set in the node to pass) |
| Pending average | the average duration between arriving at the step and execution of the activity set in the node logic |
| Pending max. | the longest duration between arriving at the step and execution of the activity set in the node logic |
| Pending min. | the shortest duration between arriving at the step and execution of the activity set in the node logic |
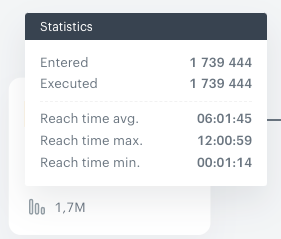
| Reach time average | the average time it took a profile to arrive at the node since triggering the workflow |
| Reach time max. | the longest time it took a profile to arrive at the node since triggering the workflow |
| Reach time min. | the shortest time it took a profile to arrive at the node since triggering the workflow |
| CTR | the click-through rate (CTR) for the message (email, mobile push, and web push) sent through a workflow (clicks from all profiles who went through this node in the workflow are included in the calculation) |
| Open Rate | the percentage of recipients that opened the email (openings from all profiles who went through this node in the workflow are included in calculations) |
| Sent | the number of sent messages (email, SMS, and web push) |
| Unique sent | the number of sent unique mobile push notifications |
| Show | the number of times a web push notification was shown to a profile |
| Timeouts | the number of times a request sent through the Outgoing integration node timed out |
| Jinjava render fail | the number of times a request sent through the Outgoing integration node failed due to Jinjava render fail (Jinjava render fail occurs when you use Jinjava to insert data you don’t have in Synerise) |
| 2xx | the number of 2xx responses to requests sent through the Outgoing integration node |
| 5xx | the number of 5xx responses to requests sent through the Outgoing integration node |
| 400 | the number of 400 responses to a request sent through the Outgoing node |
| 401 | the number of 401 responses to a request sent through the Outgoing node |
| 402 | the number of 402 responses to a request sent through the Outgoing node |
| 403 | the number of 403 responses a request sent through the Outgoing node |
| 404 | the number of 404 responses to a request sent through the Outgoing node |
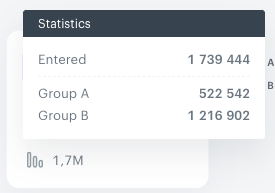
| Allocation in the AB test node | In the ABx test node statistics, you can see the number of profiles allocated to the groups defined in the node. |
Examples
Event tracking
In the Automation module, each activity (movement between steps in the workflow) of the profile is translated into events and available on the activity list.
All activities connected with Automation are tracked by default. You don’t have to enable tracking manually, the events related to moving between the nodes in the workflow will be available in the Analytics module and on the activity list on a profile’s card (they are subject to retention).
- Events are kept in the database for a retention period that differs between workspaces. To check the retention of a particular event type, contact your system administrator.
- Events generated in relation to activities in workflows may appear with a slight delay due to overloads caused by increased traffic. This has no impact on workflow execution.