Questions about Synerise monitoring alerts
You can subscribe to automatic monitoring email alerts for your workspace from the Synerise Team. The email will be sent to subscribed workspace members in case of significant changes in critical events in the workspace.
Below you can find a detailed description of the alerts.
Why subscribe?
Monitoring the changes in your company’s workspace increases effectiveness of the actions you initiate and makes you aware of what is happening in your workspace.
We want you to be informed as much as possible about the changes that happen in your workspace so you can react quickly to critical indicators that require immediate action.
How to subscribe?
You can become a subscriber in one of the following ways:
- Contact the Synerise Support Team through the Service desk and indicate the workspace for which you want to subscribe to the email alerts.
- If you log in often, Synerise will add you to the list automatically.
How many people can subscribe?
Up to 5 members of a Workspace can subscribe to the alerts.
What is in the alert?
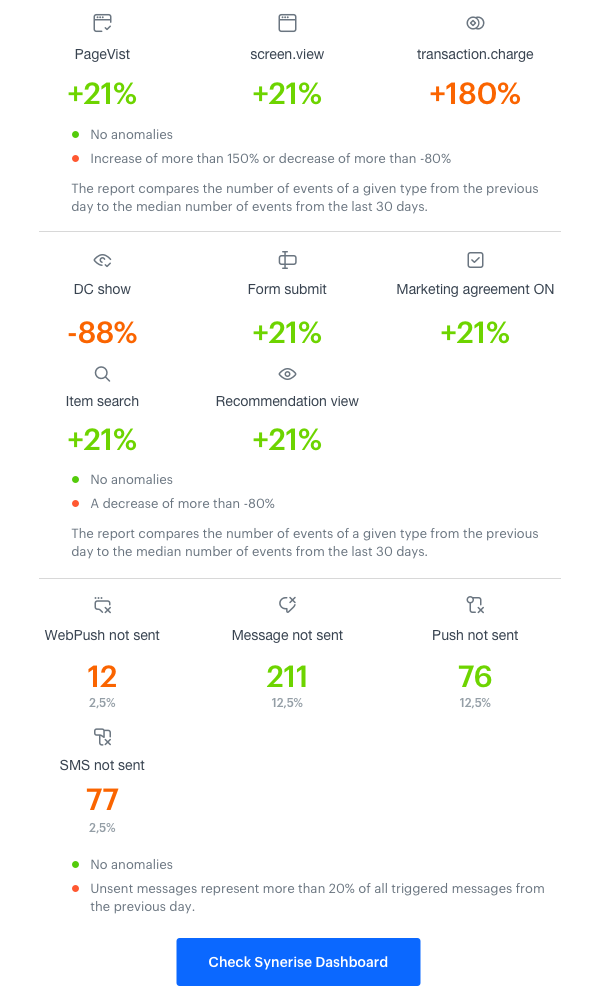
The email alert consists of two parts:
Report on the message related events
An email contains a report on the ratio of unsent messages to all launched (the total of sent and unsent) messages from the day before.
For example:
- Number of launched messages - 1000
- Number of unsent messages - 250
The report shows25%/250unsent messages.
The following events are included in the report:
message.sendmessage.notSentwebpush.sendwebpush.notSentsms.sendsms.notSentpush.sendpush.notSent
Report on the other events
An email alert includes a report that compares the number of events in a particular day to the median of the event quantity from the last 30 days.
For example:
- Number of the
page.visitevent from the previous day: 100 - Median of the
page.visitevent from the last 30 days: 1000
The report shows a-90%decrease.
The following events are included in the report:
page.visitscreen.viewtransaction.chargeitem.searchrecommendation.viewdynamicContent.showform.submitmarketingAgreement.turnOninApp.show
How to interpret the title of email alert?
The title consists of three parts:
- The icon
 - The alert concerns the metric connected with unsent messages
 - The alert concerns the increase in one or more metrics by 150%
 - The alert concerns the decrease in one or more metrics by 80%
- The name of the workspace
- Event name the email alert is concerned with
In the case when the anomaly is detected in more than one metric (for example, there is a decrease in the number of transaction.charge and page.visit events), the title includes only the name of one metric anyway. In such case, the name of the metric in the title is selected according to the following hierarchy:
page.visitscreen.viewtransaction.chargeitem.searchrecommendation.viewdynamicContent.showinApp.showform.submitmarketingAgreement.turnOnsms.notSentpush.notSentwebpush.notSentmessage.notSent
When is an email alert sent?
The email alert is sent when the number of critical events decreases or increases by a specific value:
-
For
page.visit,screen.view, andtransaction.chargeevents the email alert is sent when:- A
80%decrease is detected - A
150%increase is detected
- A
-
For
dynamicConent.show,inApp.show,form.submit,marketingAgreement.turnOn,item.search, andrecommendation.viewevents the email alert is sent when a80%decrease is detected -
For
message.notSent,webpush.notSent,push.notSent, andsms.notSentevents the email alert is sent when the unsent messages count for20%or more triggered messages from the day before or when the number of unsent messages is higher than 20 000
How often is the email alert sent?
The email alert on non-message related events is sent only if an anomaly is detected, once per given anomaly. It means that when a given anomaly is detected (for example, sharp decrease in the page.visit event is detected), you receive the email alert about this particular anomaly only once. After the issue is fixed, the email alert is sent if the anomaly concerning the same event happens again.
EXAMPLE
You received an alert on the 9th of January, 2023 about decrease in the page.visit event. The issue is fixed on the 11th of January. And between these two dates, the alert about decrease from the 9th of January isn’t resent.
The email alert on message-related events can be delivered on a daily basis. If it’s too frequently, you can contact the Synerise Support team and disable particular metrics.
What does “below limit” mean?
Message related events
For message related events, “below limit” means that the number of unsent messages from the day before didn’t exceed the threshold that triggers the email alert. The threshold is counted based on the metrics that calculate the number of unsent messages the day before. Below you can find the limits that must be exceeded in order to trigger the alert:
message.notSent- number is greater than 200webpush.notSent- number is greater than 200push.notSent- median is greater than 200sms.notSent- median is greater than 200
Other events
For other events, “below limit” means that the number of events from the day before didn’t exceed the threshold that triggers the email alert. The threshold is counted based on the metrics that calculate the median of the event number from the last 30 days. Below you can find the limits that must be exceeded in order to trigger the alert:
page.visit- median is greater than 200screen.view- median is greater than 200transaction.charge- median is greater than 20dynamicContent.show- median is greater than 200marketingAgreement.turnOn- median is greater than 10form.submit- median is greater than 50item.search- median is greater than 10recommendation.view- median is greater than 100inApp.show- median is greater than 200
What does “disabled” status mean?
The “disabled” status means that the metric has been excluded manually from the alert. The metric can be included again any time by contacting the Synerise Support Team through the service desk.
Can I select metrics in the alert?
By default, we include a complete set of metrics in the email alert. In some cases, we can exclude a metric for unsent messages (email, sms, web push or push). To do so, contact the Synerise Support Team through the service desk.
Can I add my metrics to the alert?
No, you can’t. The alert informs about the anomalies in the most common events.
If you want to create a custom alert, you can do it in the Automation module.
Can I add or remove subscribers?
Yes, you can. To do so, contact the Synerise Support Team.
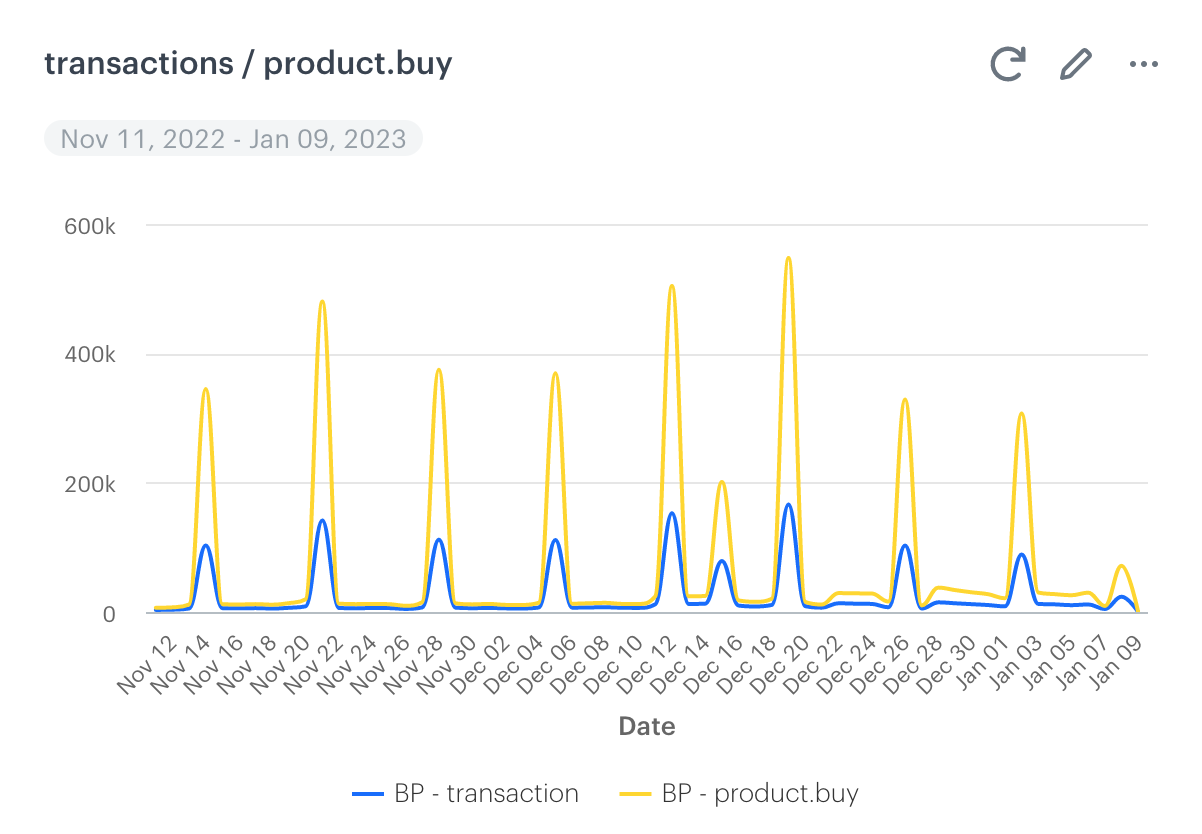
How do data imports impact the alerts?
Data imports can trigger the email alert. For example, the transaction import can trigger an alert about the increase of the transaction.charge events. In such case, the date of import is treated as the date of event occurrence. This may cause inconsistency in data between the workspace and the alert. Because while importing transactional data from the last 30 days, for example, these data will be distributed among profiles according to the date when a transaction was made. However, the monitoring system treats it as if the transaction happened within one day.
Below, you can compare the alert metric and the metric on workspace on transactions:
Does the email alert exclude the periodical anomalies?
Yes, the email alert excludes the periodical anomalies if the monitoring system finds a repetitive pattern of anomalies.
For example, each Sunday the number of transaction.charge events drops by more than 80%. If such a situation occurs for 3 weeks in a row, the alert will not be sent anymore in the event of this particular anomaly. If the periodical anomaly is disrupted (for example, the anomaly doesn’t occur in the expected period), the system is reset, and the email alert is sent again when the first occurrence of the periodical anomaly happens again after the reset.
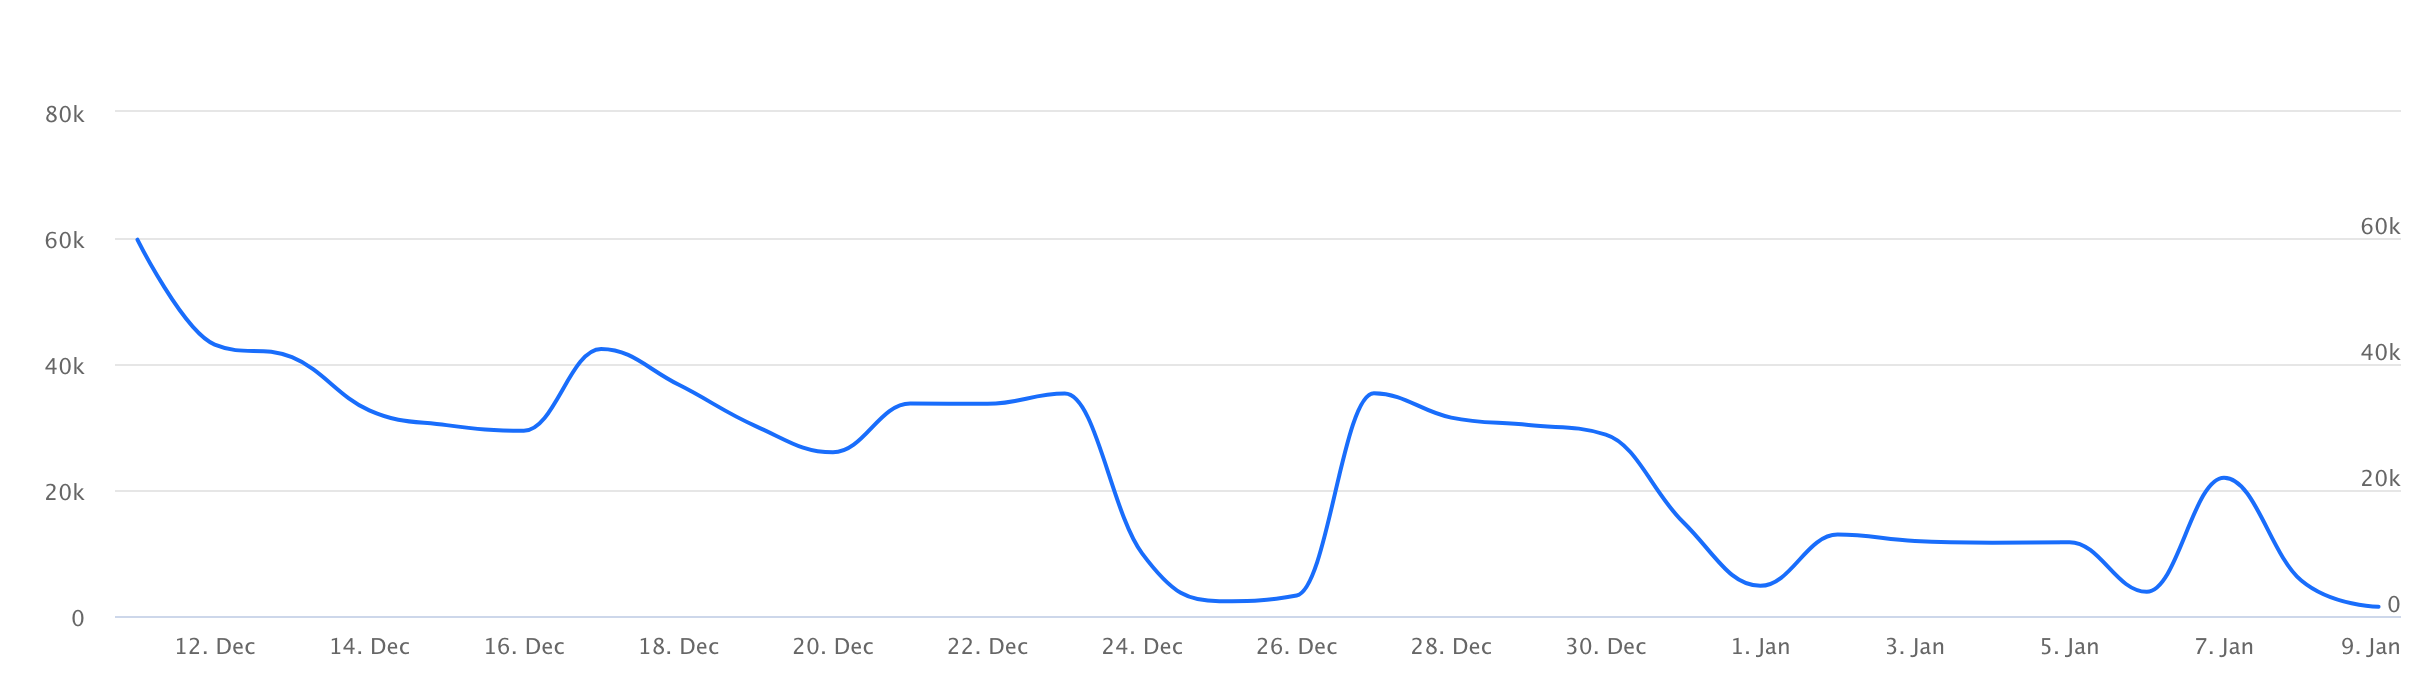
Data from the alert are inconsistent with the data in workspace
Data incoherence between the alert and the workspace may be caused by import of data or event retention.
- Data import - While importing events, they are distributed among profiles in the workspace according to the date occurrence, however, the monitoring system treats it as if all the events occurred in one day.
- Date ranges - The alert system always uses data from the last 30 days. If you prepare your own dashboards and reports in analytics which use a different time filter, or your workspace operates on short event retention, for example, 7 days, your results (such as event occurrence median) may differ. The 30-day data range for alerts isn’t affected by the event retention settings of your profile
Below, you can compare the alert metric and the metric on workspace on transactions:
I receive too many alerts
You can consider excluding single metrics from the alert, for example, a metric connected with the number of unsent messages.
If it still too much, you can consider unsubscribing and providing feedback by contacting the Synerise Support Team through the service desk.