Number of sold products per segment
Measuring shopping trends can give you knowledge about customer behavior. This allows you to optimize specific rebate levels or benefits granted to clients in relation to their likelihood to buy.
In the graph below we can see how the amount of products added to the basket changes over time. You can see that the largest number of customers are those who buy more than 3 products but less than 10, then there are customers who shop for up to 3 products, and finally customers shopping above 10. In this way you can divide your database into segments and compare them based on the number of sold products every year.
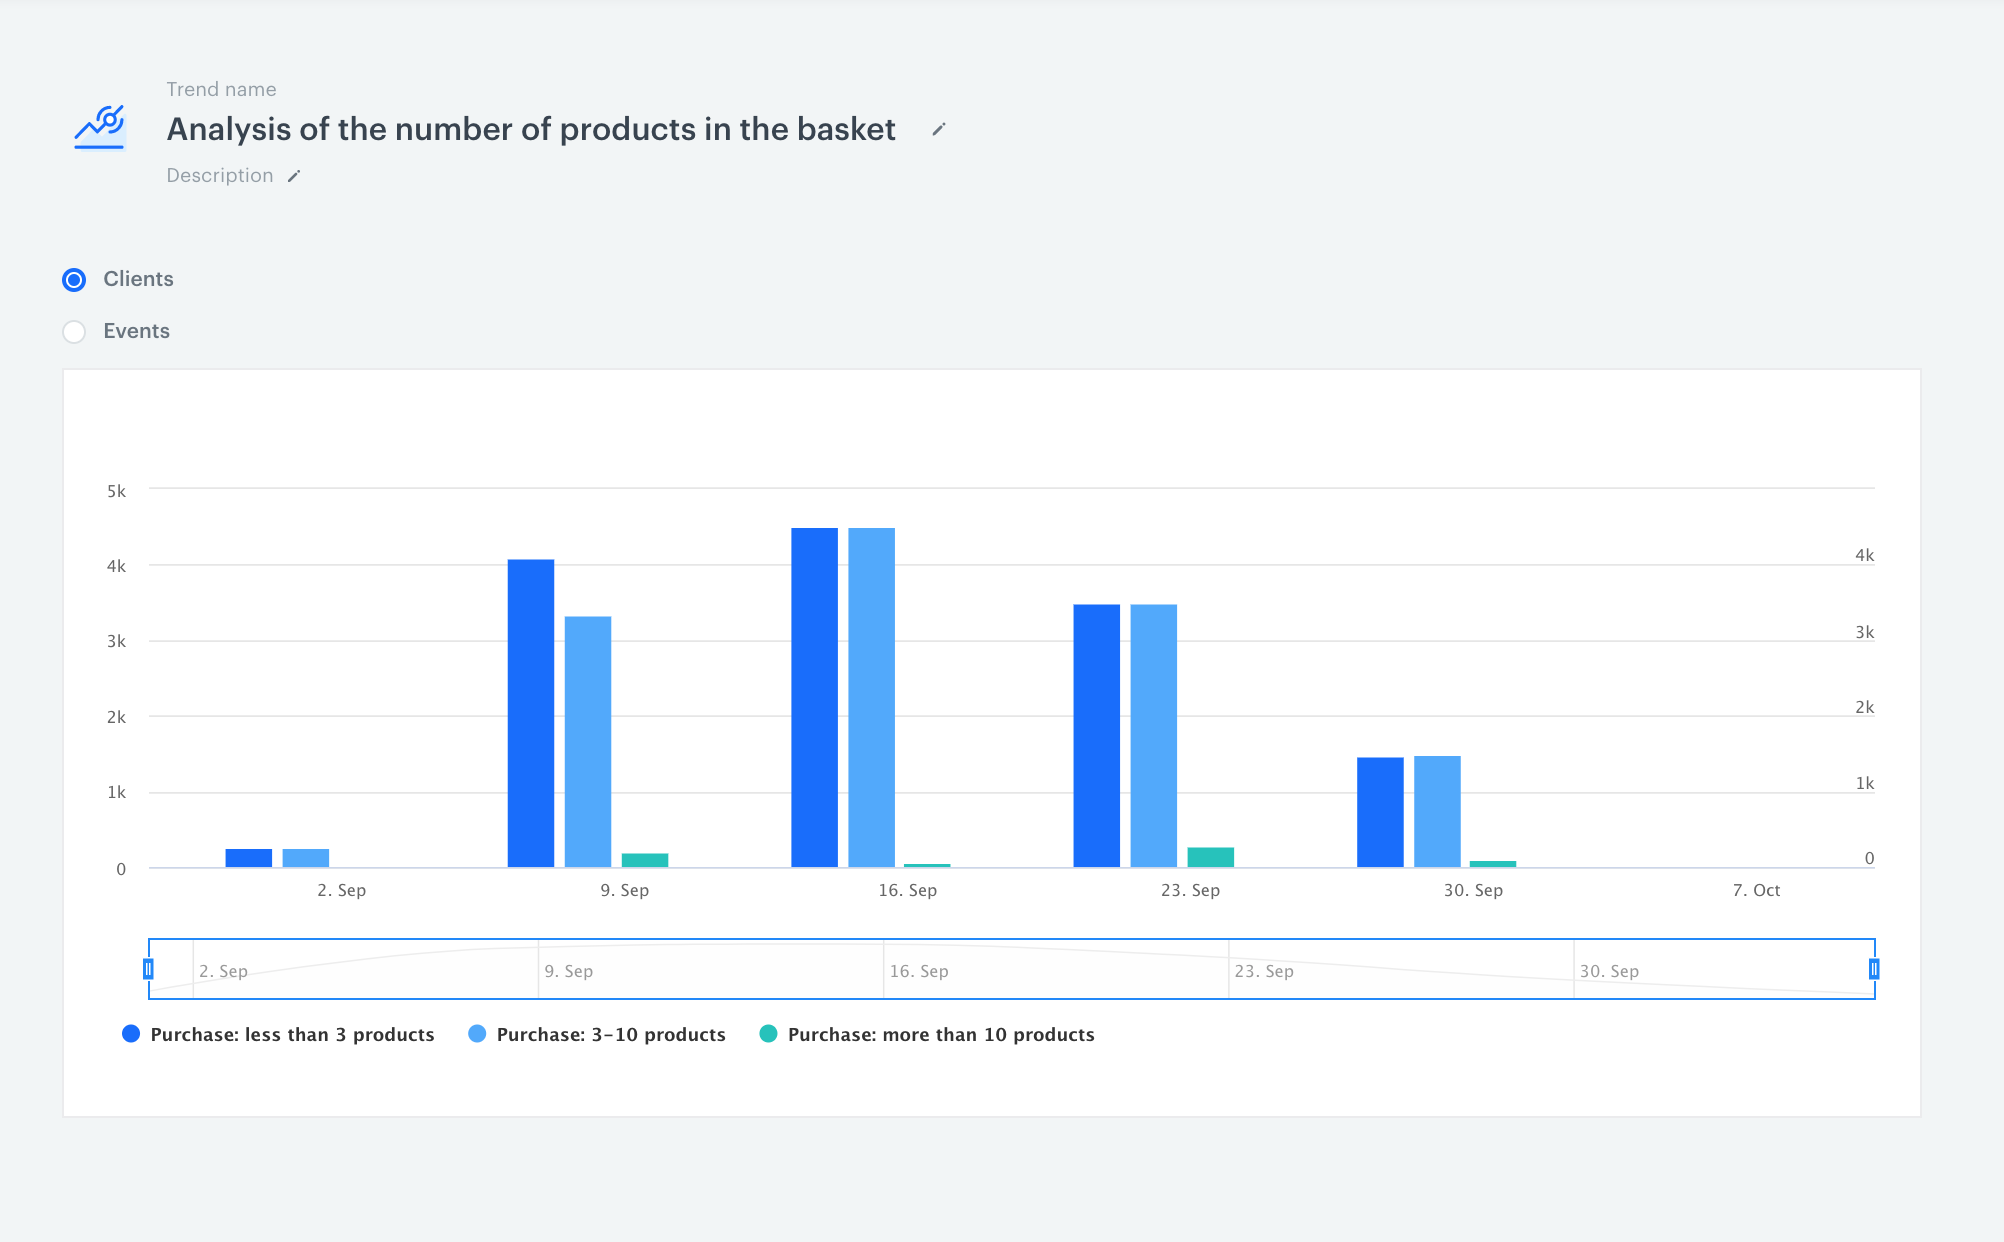
You can also combine different indicators and compare different segments. You can estimate which segment buys the biggest amount of products. To do this use filter in your trends and choose one segment from the list. In this way you will be able to check how many people from this segment have bought specific products. The results obtained can also be used as a guideline for future promotions and marketing communication. In this case, you can send information about promotions for a set of products to the segment of people who most often purchase more than 1 product at once.
How to do it
Thanks to trends, you have the opportunity to analyze and observe changes in order to undertake the appropriate business activities (in this case number of sold products per segment).
If you want to create this kind of analytic, read more about trends.
In this way you can assess how big potential have specific segments and on how many of them you have to focus on.