
Identify products purchased at a promotional price
In order to better match the offer with the customer’s needs, a company needs to conduct an in-depth analysis of the customers’ behavior and buying habits on its website. Knowing what products have been purchased as part of a promotion can prove to be very important and beneficial and can be used later while creating different campaigns.
Prerequisites
- A tracking code implemented into the website.
- Send information about transactions through SDK or API.
Process
In this use case, you will go through the following steps:
Create an expression
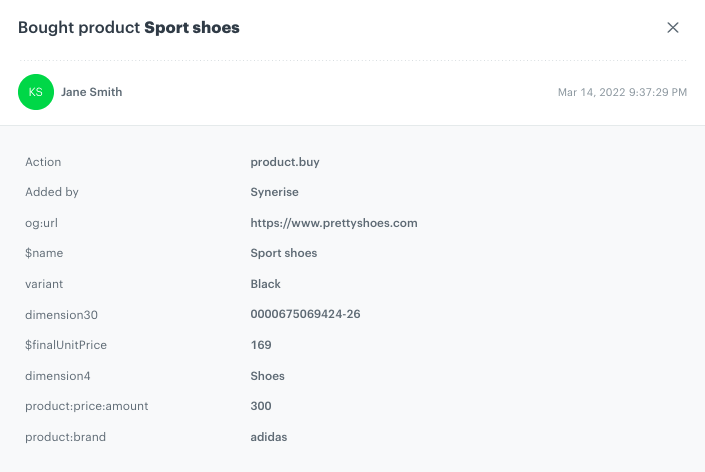
After a purchase is made, the product.buy event appears in the customer’s profile. This event contains two parameters: product:price:amount - describing the original price of the product and $finalUnitPrice - describing the final price of the product. The transaction event does not indicate whether the purchased product was covered by a promotion (unless such a parameter has been implemented into the workspace).
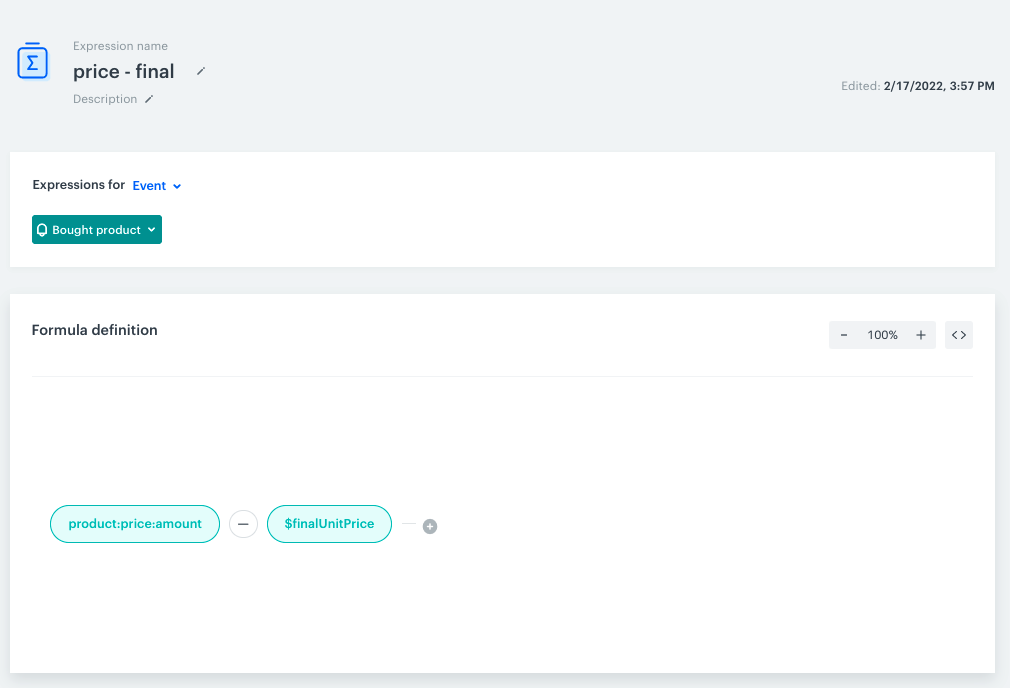
Using Synerise Analytics, you can create an event expression that deducts the price of the purchased product from the regular price.
Create an expression that calculates the difference between the initial and the final price of the product.
- Go to
 Analytics > Expression > New expression.
 - Enter the name of the expression.
- Set the Expression for option to Event.
- From the dropdown list, select Bought products.
- Click the unnamed node.
- From the Choose attribute dropdown list, select product:price:amount.
- Click the plus icon.
- From the dropdown list, select Event attribute.
- From the Choose attribute dropdown list, select $finalUnitPrice.
- Change the mathematical operator between these two parameters to minus.
- Save the expression.
Create a metric
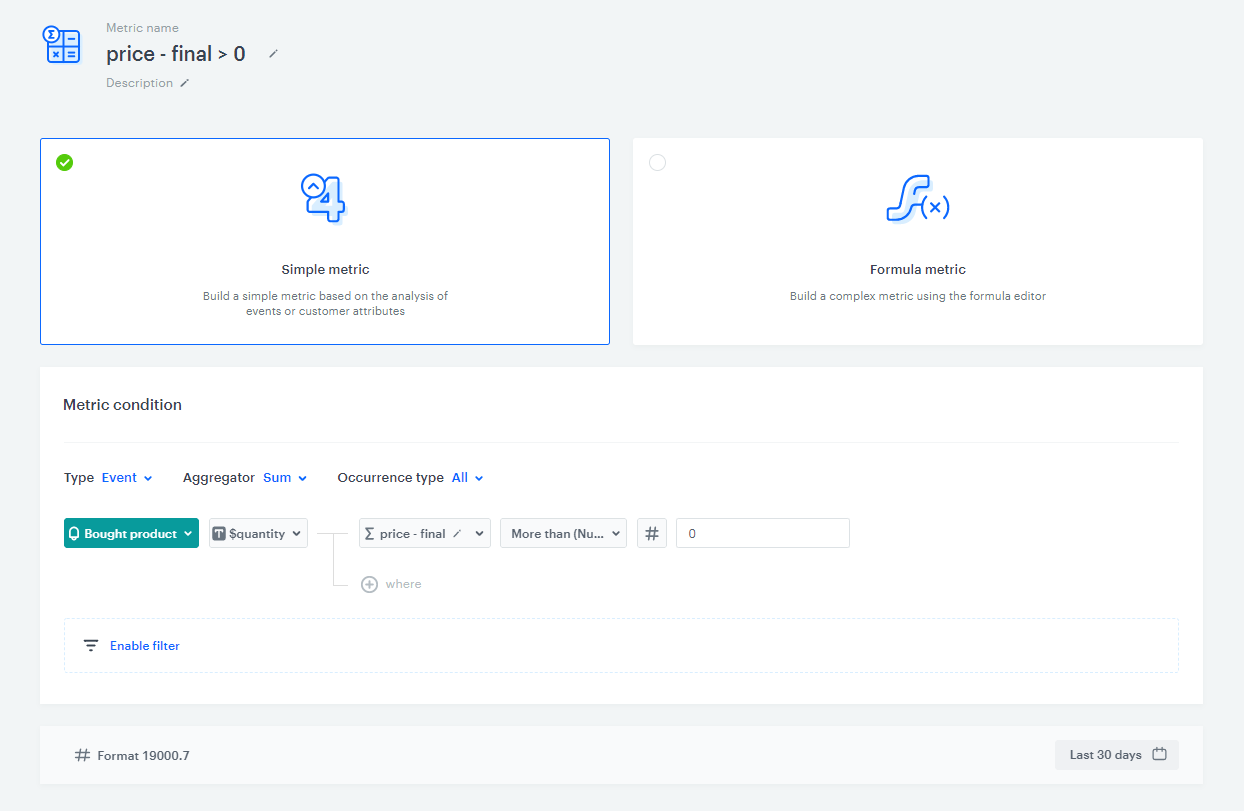
In this part of the process, you create metrics to see how many products were purchased at a discount. This metric will include the expression - if the result of this expression is greater than 0, it means that the product was bought at a discount.
- Go to Analytics > Metrics > New metric.
- Enter a meaningful metric name.
- Leave the metric kind at default (Simple).
- As the aggregator type, select Sum.
- Select the Bought product event.
- Add the $quantity parameter.
- Select the where input that appeared on the canvas.
- Select the expression created in the previous step.
- Choose the More than number operator.
- Keep clicking the icon next to the logical operator until you get # icon.
- In the blank field, enter
0. - Select the date range of the metric (for example, last 30 days)
- Save the metric.
Create a segmentation
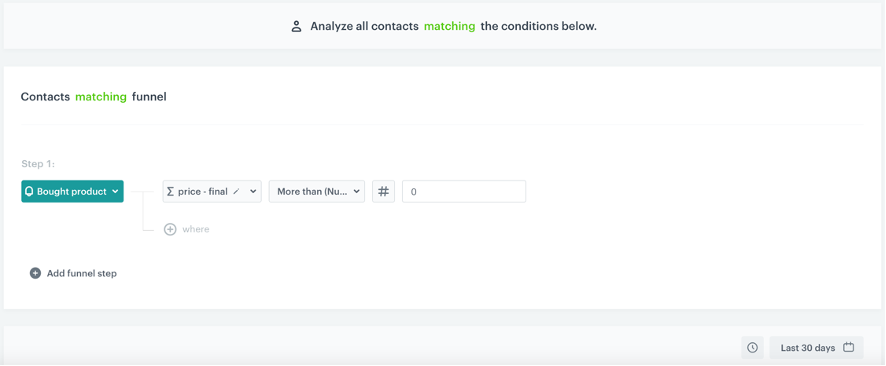
Create a segmentation to see how many customers bought discounted products.
- Go to Analytics > Segmentation > New Segmentation.
- Enter the name of segmentation.
- On the canvas, click Choose filter.
- From the dropdown list, select the Bought product event.
- Select the where input that appeared on the canvas.
- Select the expression created in the previous step.
- Choose the More than number operator.
- Keep clicking the icon next to the logical operator until you get # icon.
- In the blank field, enter
0. - Select the date range of the segmentation (for example, last 30 days).
- Save the segmentation.
Create a report
In this part of the process, create a report to clearly show the most frequently purchased discounted products, displaying the product parameters that interest you the most (in our example, we display the product names).
- Go to Analytics > Report > New report.
- Enter the name of the report.
- Select the metric you created in this part of the process.
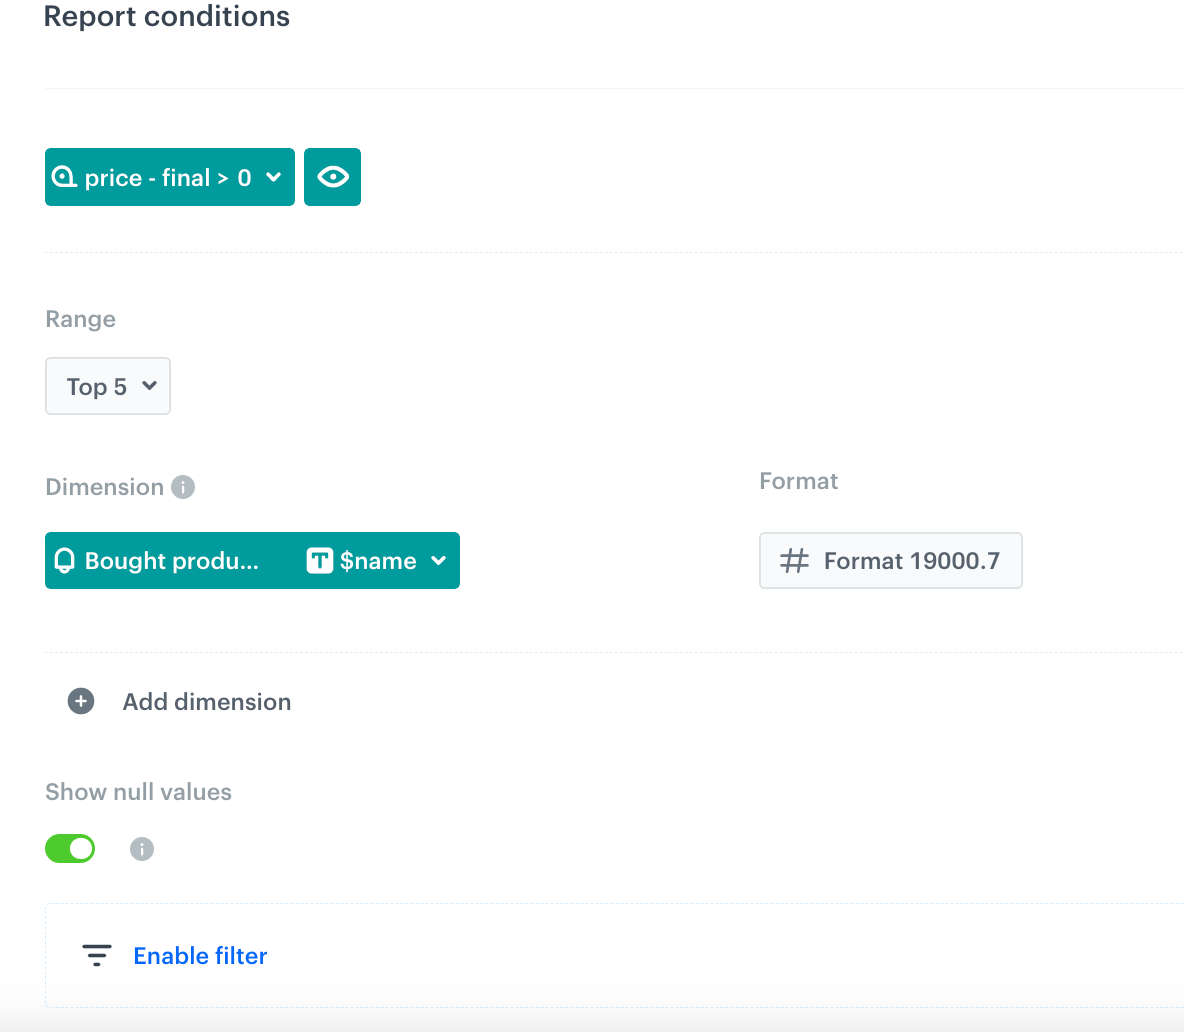
- From the Range dropdown list, select the number of top (the most frequently bought products) to be shown in the preview of the report.
- In the Dimension section, choose a parameter from product.buy suggesting what the product is. Among the most common parameters, you can choose $name or $sku.
- In the date range, select the time that will be analyzed.
Important: Select the same date range as you selected for the metric and the segmentation.
- Save the report.
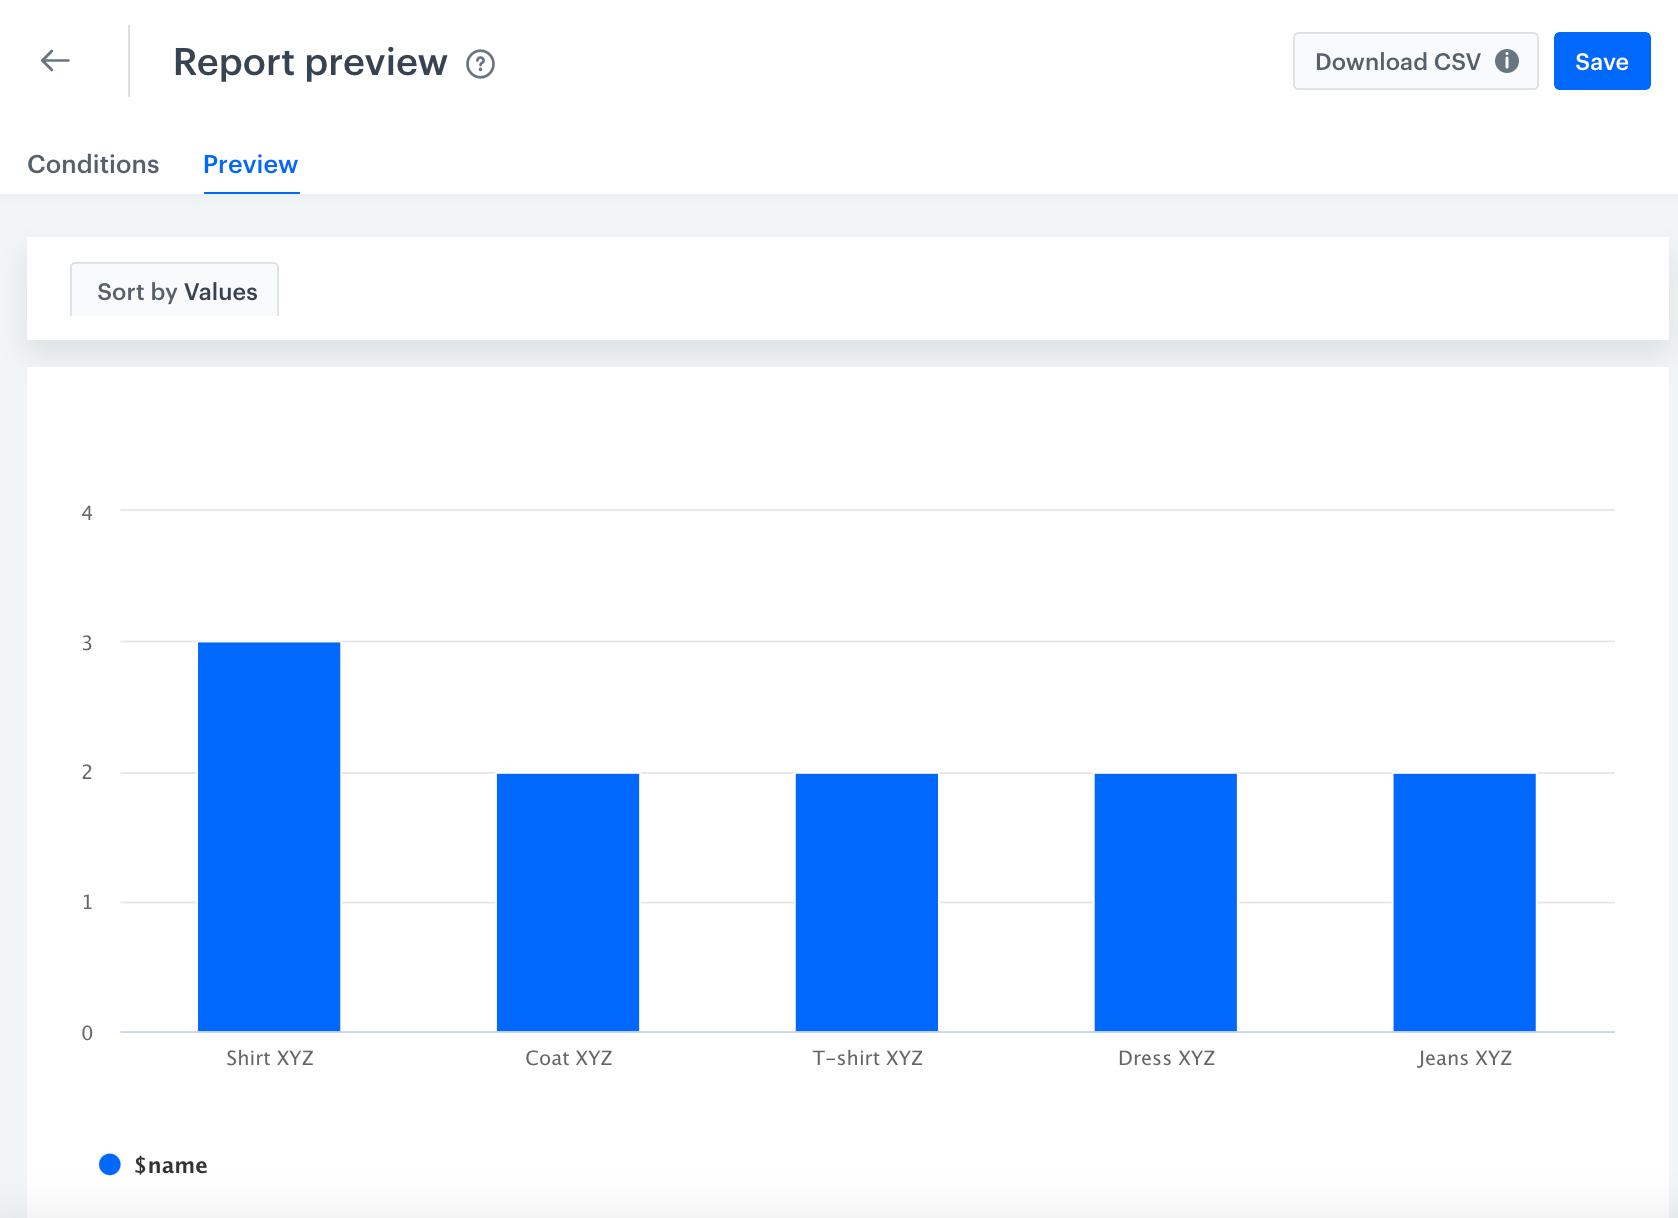
- Click preview to see the results.
The report will return information about how many, for example, XYZ shoes were purchased at a discount.
Check the use case set up on the Synerise Demo workspace
You can find the analyses created in this use case in our Synerise Demo profile at the following links:
If you don’t have access to the Synerise Demo workspace, please leave your contact details in this form, and our representative will contact you shortly.