
Create a report that counts purchases among specific product groups
While creating a purchase analysis of specific products, we often want to group them according to specific rules, for example, by their category. However, the product category is not always added to the parameters of the transaction event. In this case, you can use the Analytics module, which creates the necessary parameter on the fly without changing the integration.
In this use case, you’ll learn how to create category parameters on the fly using Synerise Analytics and how to create a report that shows how many purchases were made for products in the defined categories.
Prerequisites
- Implement transaction events using SDK or API.
- Prepare a list of product SKUs that you would like to group into specific product categories.
Process
- Create an expression that groups sold products into categories based on their SKU.
- Create a metric that returns the number of products purchased within the defined category.
- Create a report that shows the metric result broken down into defined groups (product categories).
Group sold products by their category with SKU
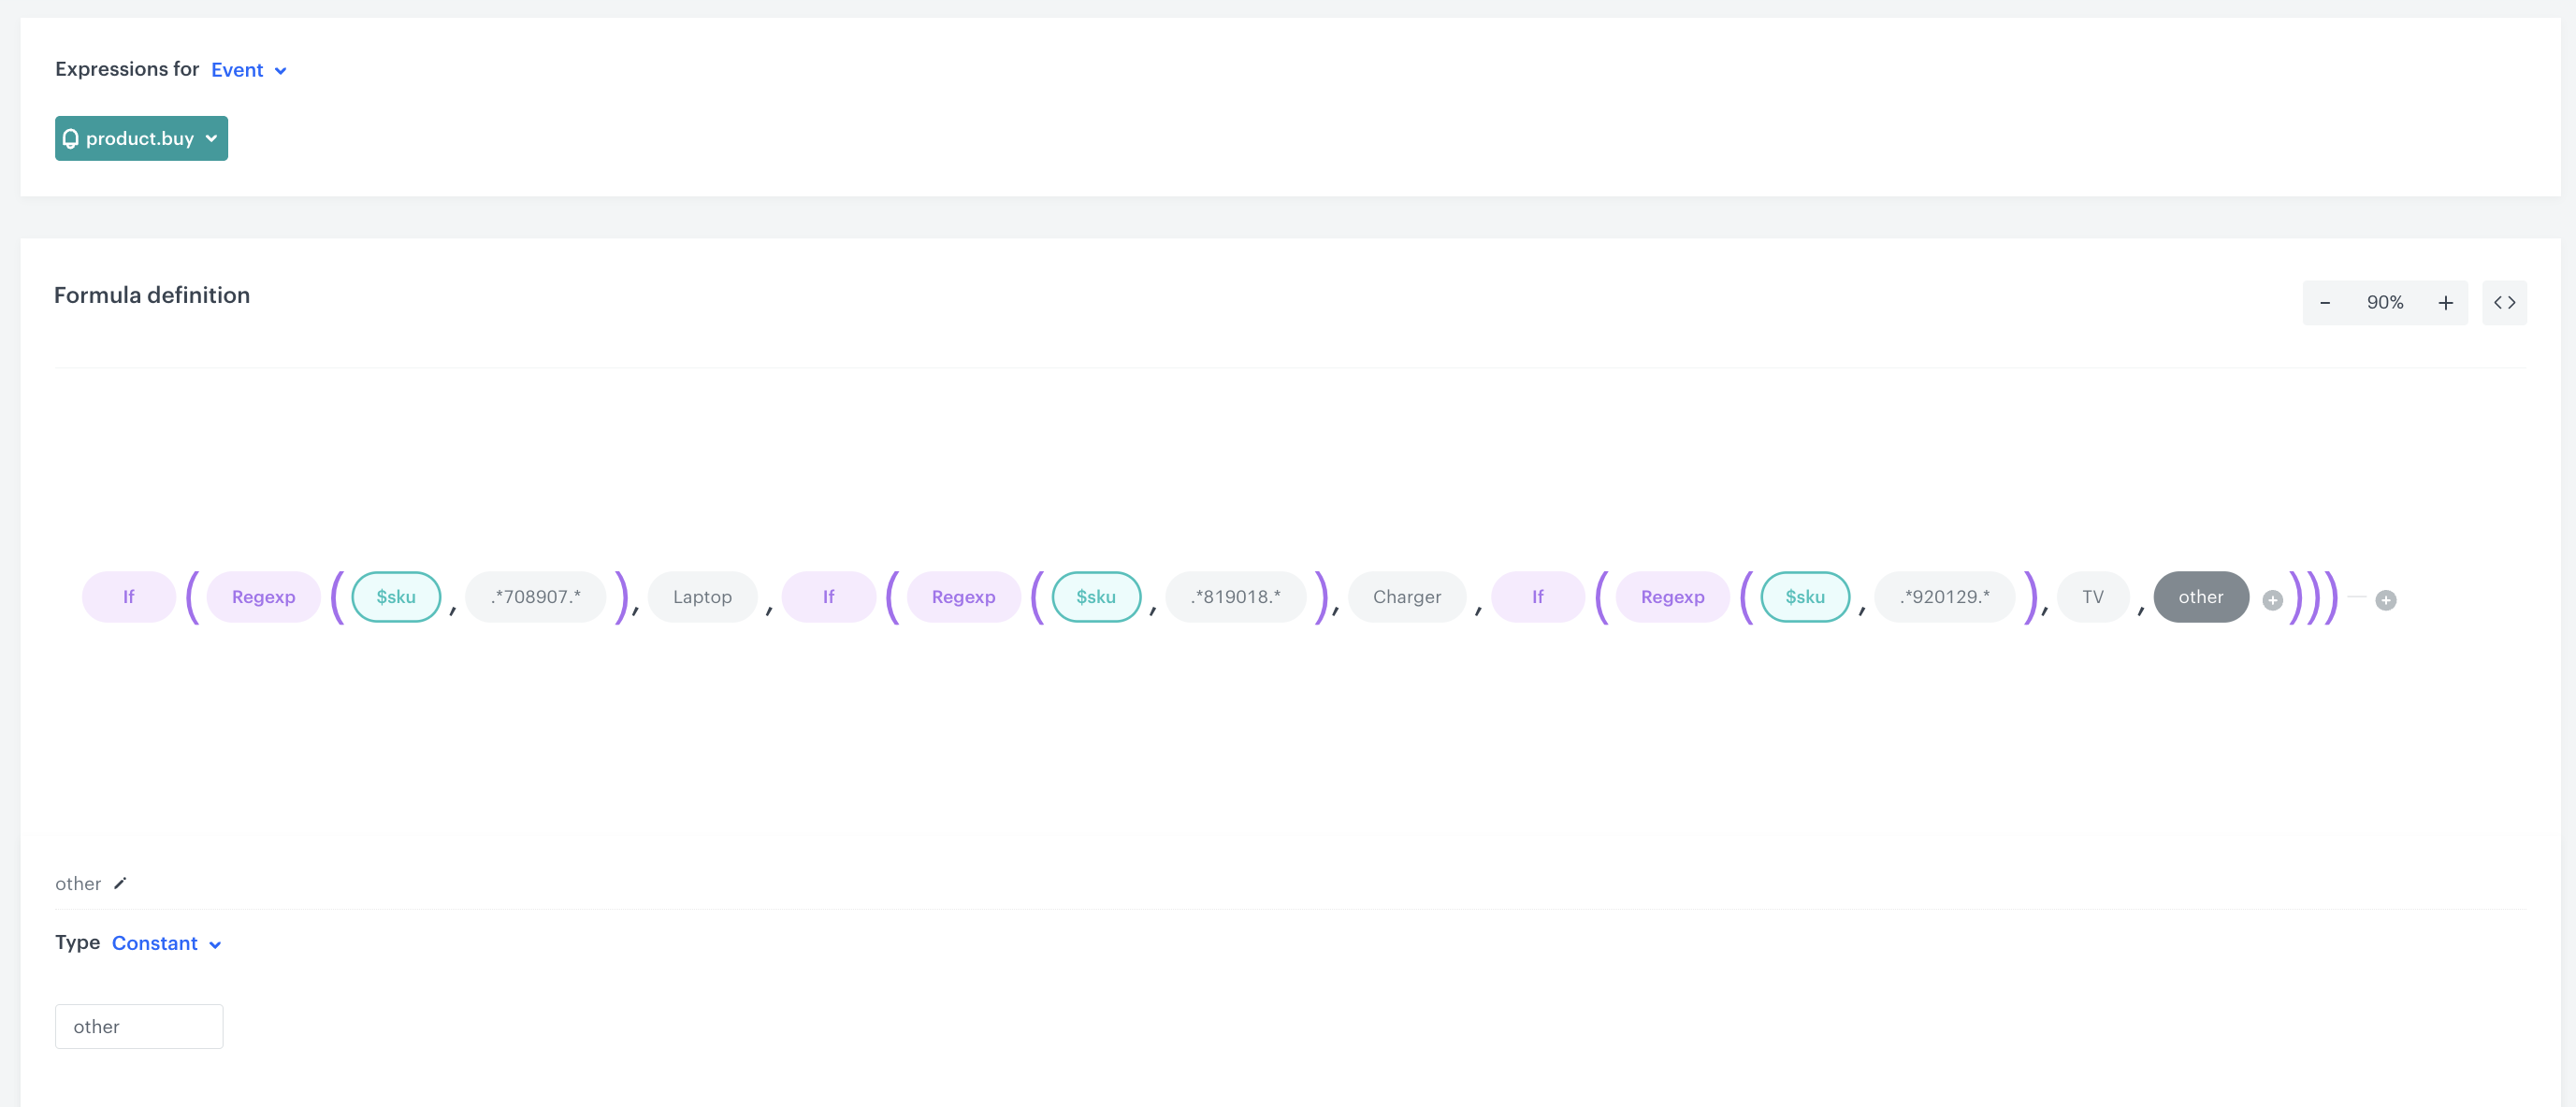
In this part of the process, you will create an event expression for the product.buy event. The formula of this expression will assign a product with a given SKU to a specific product category.
If the SKU is included in the group corresponding to the regular expression conditions (constant with the value “.XXXX.”), then the expression assigns it to the product group (for example, constant with the value Laptop). The next groups of products will be added in the same way. If the product doesn’t meet the expression conditions, it will be assigned to the other category.
- Go to
 Analytics > Expression > New expression.
 - Enter the name of the expression.
- Set the Expression for option to Event.
- From the dropdown list, select product.buy.
- Build the expression as shown in the screenshot below:
Create a metric
Create a metric to receive the number of purchased products of the groups defined in the previous step.
- Go to Analytics > Metrics > New mertic.
- Enter the name of the metric.
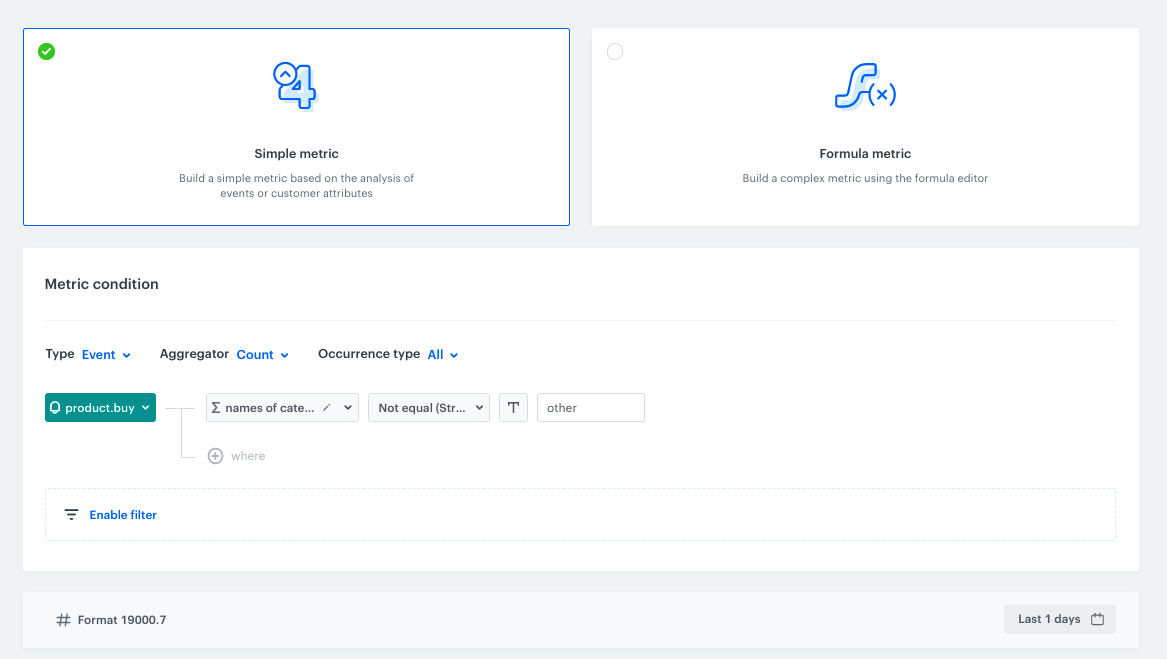
- As a metric kind, select Simple metric.
- As the aggregator, set Count.
- As the occurrence type, set All.
- From the Choose event dropdown list, select product.buy event.
- Click Where button.
Result: The Choose parameter button appears. - Click the Choose parameter button.
Result: A pop-up appears. - On the pop-up, click the three-dot button
Result: A dropdown shows. - From the dropdown, select Expressions.
- In the list of expressions, find the event expression you have created earlier.
- Click the Choose parameter button.
- From the dropdown, select Not equal.
- In the text field, enter
other. - To select a specific time range, click the calendar icon.
- Confirm your choice with the Apply button.
- Save metrics.
Create a report
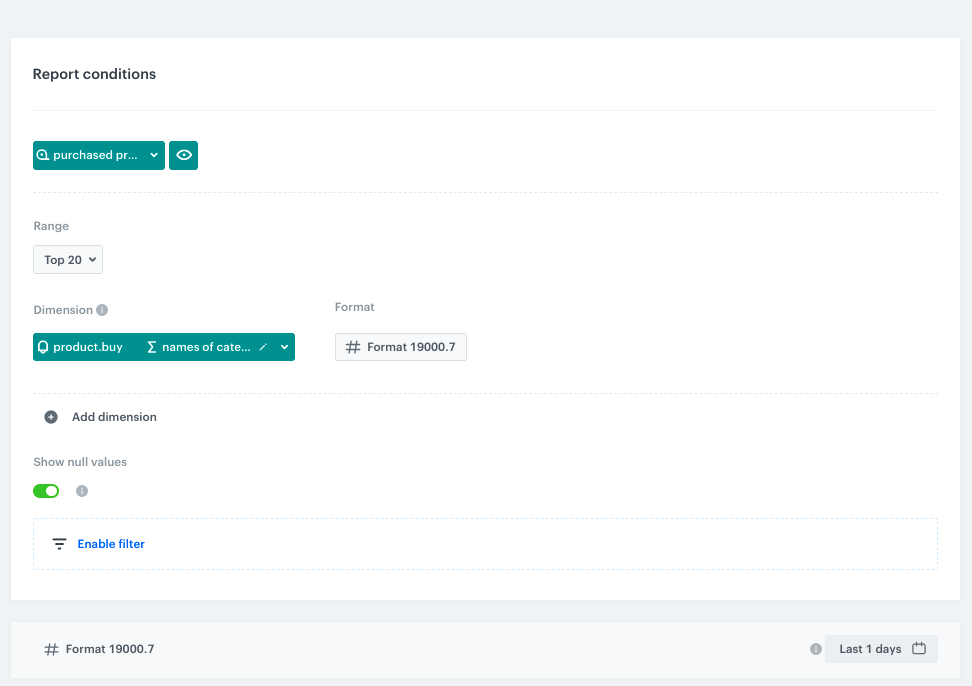
In this part of the process, create a report based on the metric and expression you prepared before. The result of the report is a table with the number of purchased products in each category over a specified time period.
-
Go to
Analytics > Reports > New report. -
Enter the name of the report.
-
Select metric you created in this part of the process.
-
From the Range dropdown list, select the number of top (the most frequently bought group of products) to be shown in the preview of the report.
Tip: The selected number of product groups in the range must be greater than the number of product groups defined in the expression - for the report to pull them all in. -
In the Dimension section, select the expression created in this step.
-
In the date range, select the time that will be analyzed.
-
Save the report.
-
Click Preview to see the results.
Preview the results of the report:
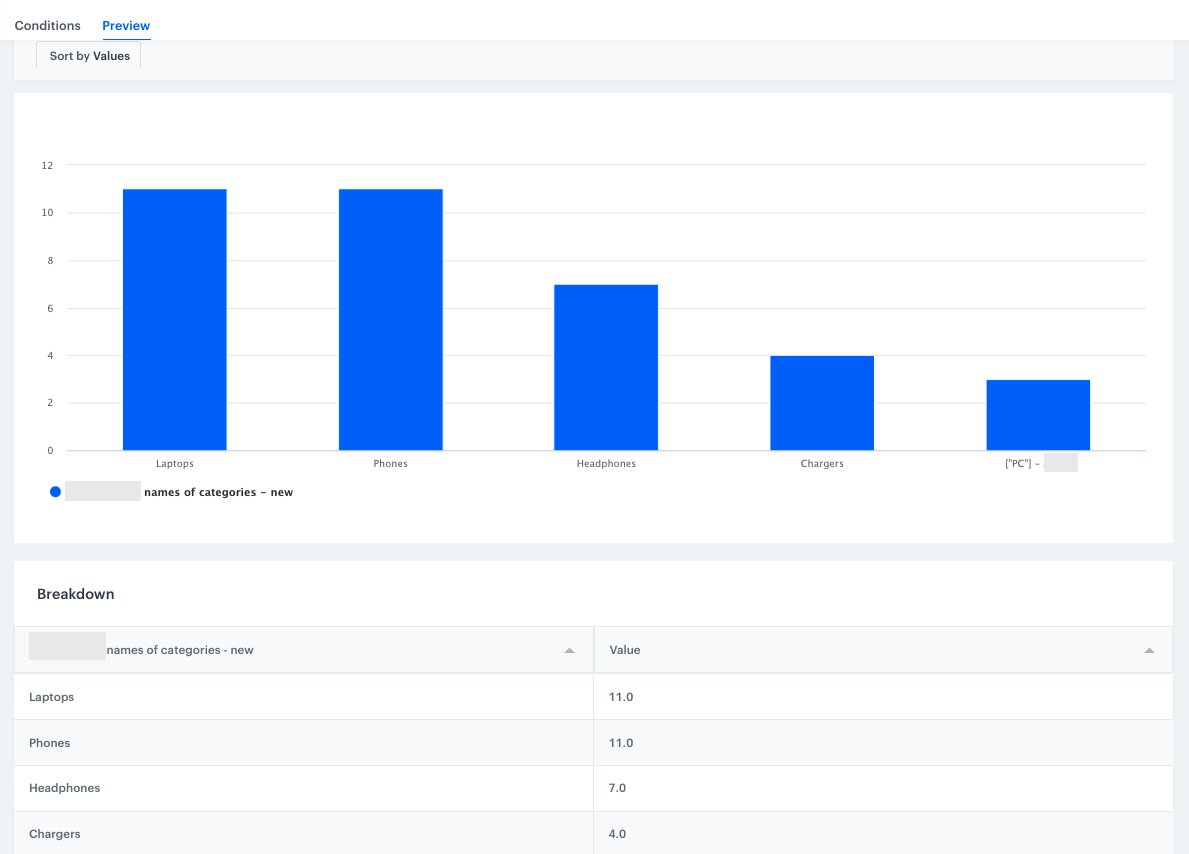
The sold products presented in the report are grouped according to predefined categories. You can use this data to compare whether sales of a particular product group have increased during the period of interest. If there has been a noticeable increase in product group sales, there is likely to be a fraud.
In this case, you can implement an alert system using email alert/sms alert nodes or outgoing integration. You can take inspiration from the following use case, which describes the process of creating a workflow that sends alert messages based on the results of metrics to a Slack channel.
Check the use case set up on the Synerise Demo workspace
You can check the configuration of each step from this use case in our Synerise Demo workspace:
If you don’t have access to the Synerise Demo workspace, please leave your contact details in this form, and our representative will contact you shortly.