Use quantiles to see value distribution
You can create a dashboard with quantile-type metrics to see how values is distributed and compare results between different cohorts and time periods.
In this example, you will create a dashboard that displays quantile values (0.25; 0.50; 0.75) and average values of transaction amounts made by male and female customers.
The use case can be modified easily by adding more metrics with other quantile values, or other conditions, such as using age groups or geographical location instead of sex, or using different events and attributes for the analysis.
The process consists of two stages:
- Creating eight metrics to include in the dashboard
- Creating the dashboard
Prerequisites
- In this example, the customers’ profiles must include information about their sex.
Process
In this use case, you will go through the following steps:
- Create eight metrics for
transaction.chargeevent. - Create dashboards presented all metrics.
Create metrics
In this stage, you will create eight metrics for transaction.charge events. The procedure describes creating a single metric, you will need to repeat the steps for each metric separately, changing the conditions each time.
-
Go to
 Analytics > Metrics > New metric.
 -
Give the metric a meaningful name.
For the purpose of this example, the first metric is for quantile 0,25 of transactions made by females. -
Leave Type at Event.
-
Change the Aggregator to Quantile.
-
In the input field which appears next to the aggregator, type
0,25 -
Leave Occurrence type at All.
-
Click Choose event and select transaction.charge.
Tip: Events may have different labels between workspaces, but you can always find them by their action name (in this step, it’s transaction.charge). -
Next to the event selector, click Choose param and select $totalAmount.
-
Click Enable filter.
-
Click Choose filter and use the Search field to find and select the Sex attribute.
-
In the text field, type
1.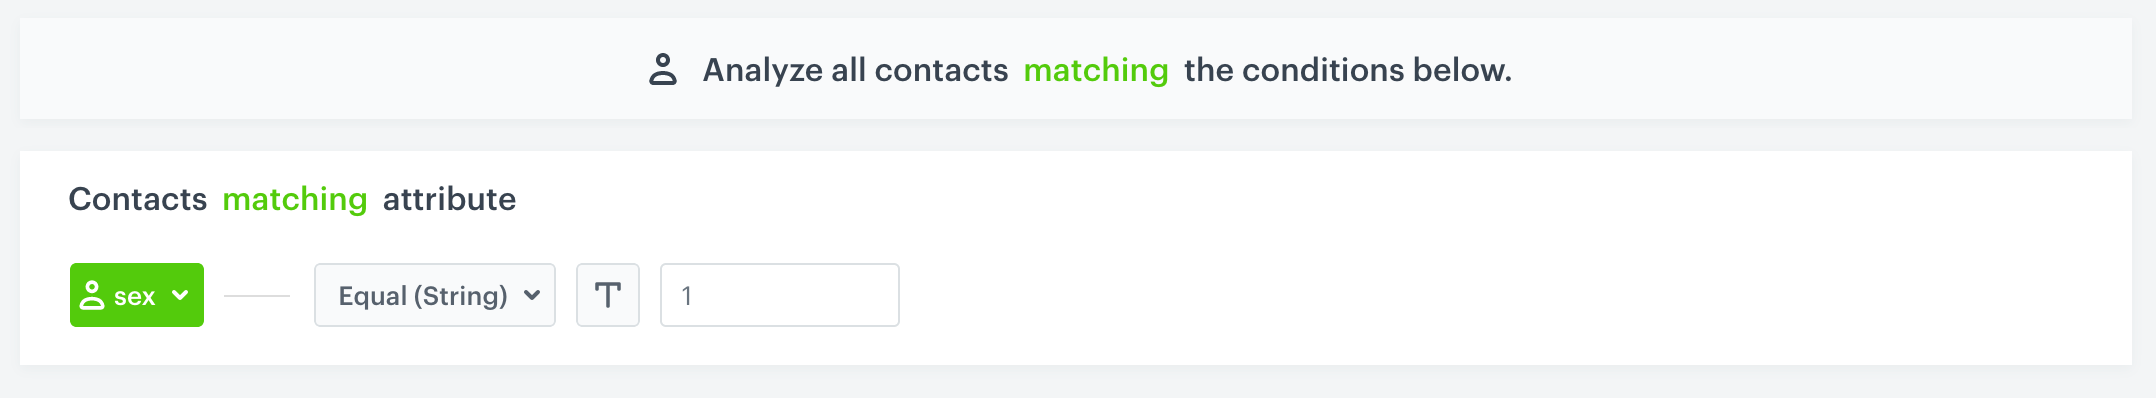
Contact filter to include only female customers Note:The values for this parameter mean:
0: not specified1: female2: male3: other
-
Click Apply.
-
Save the metric.
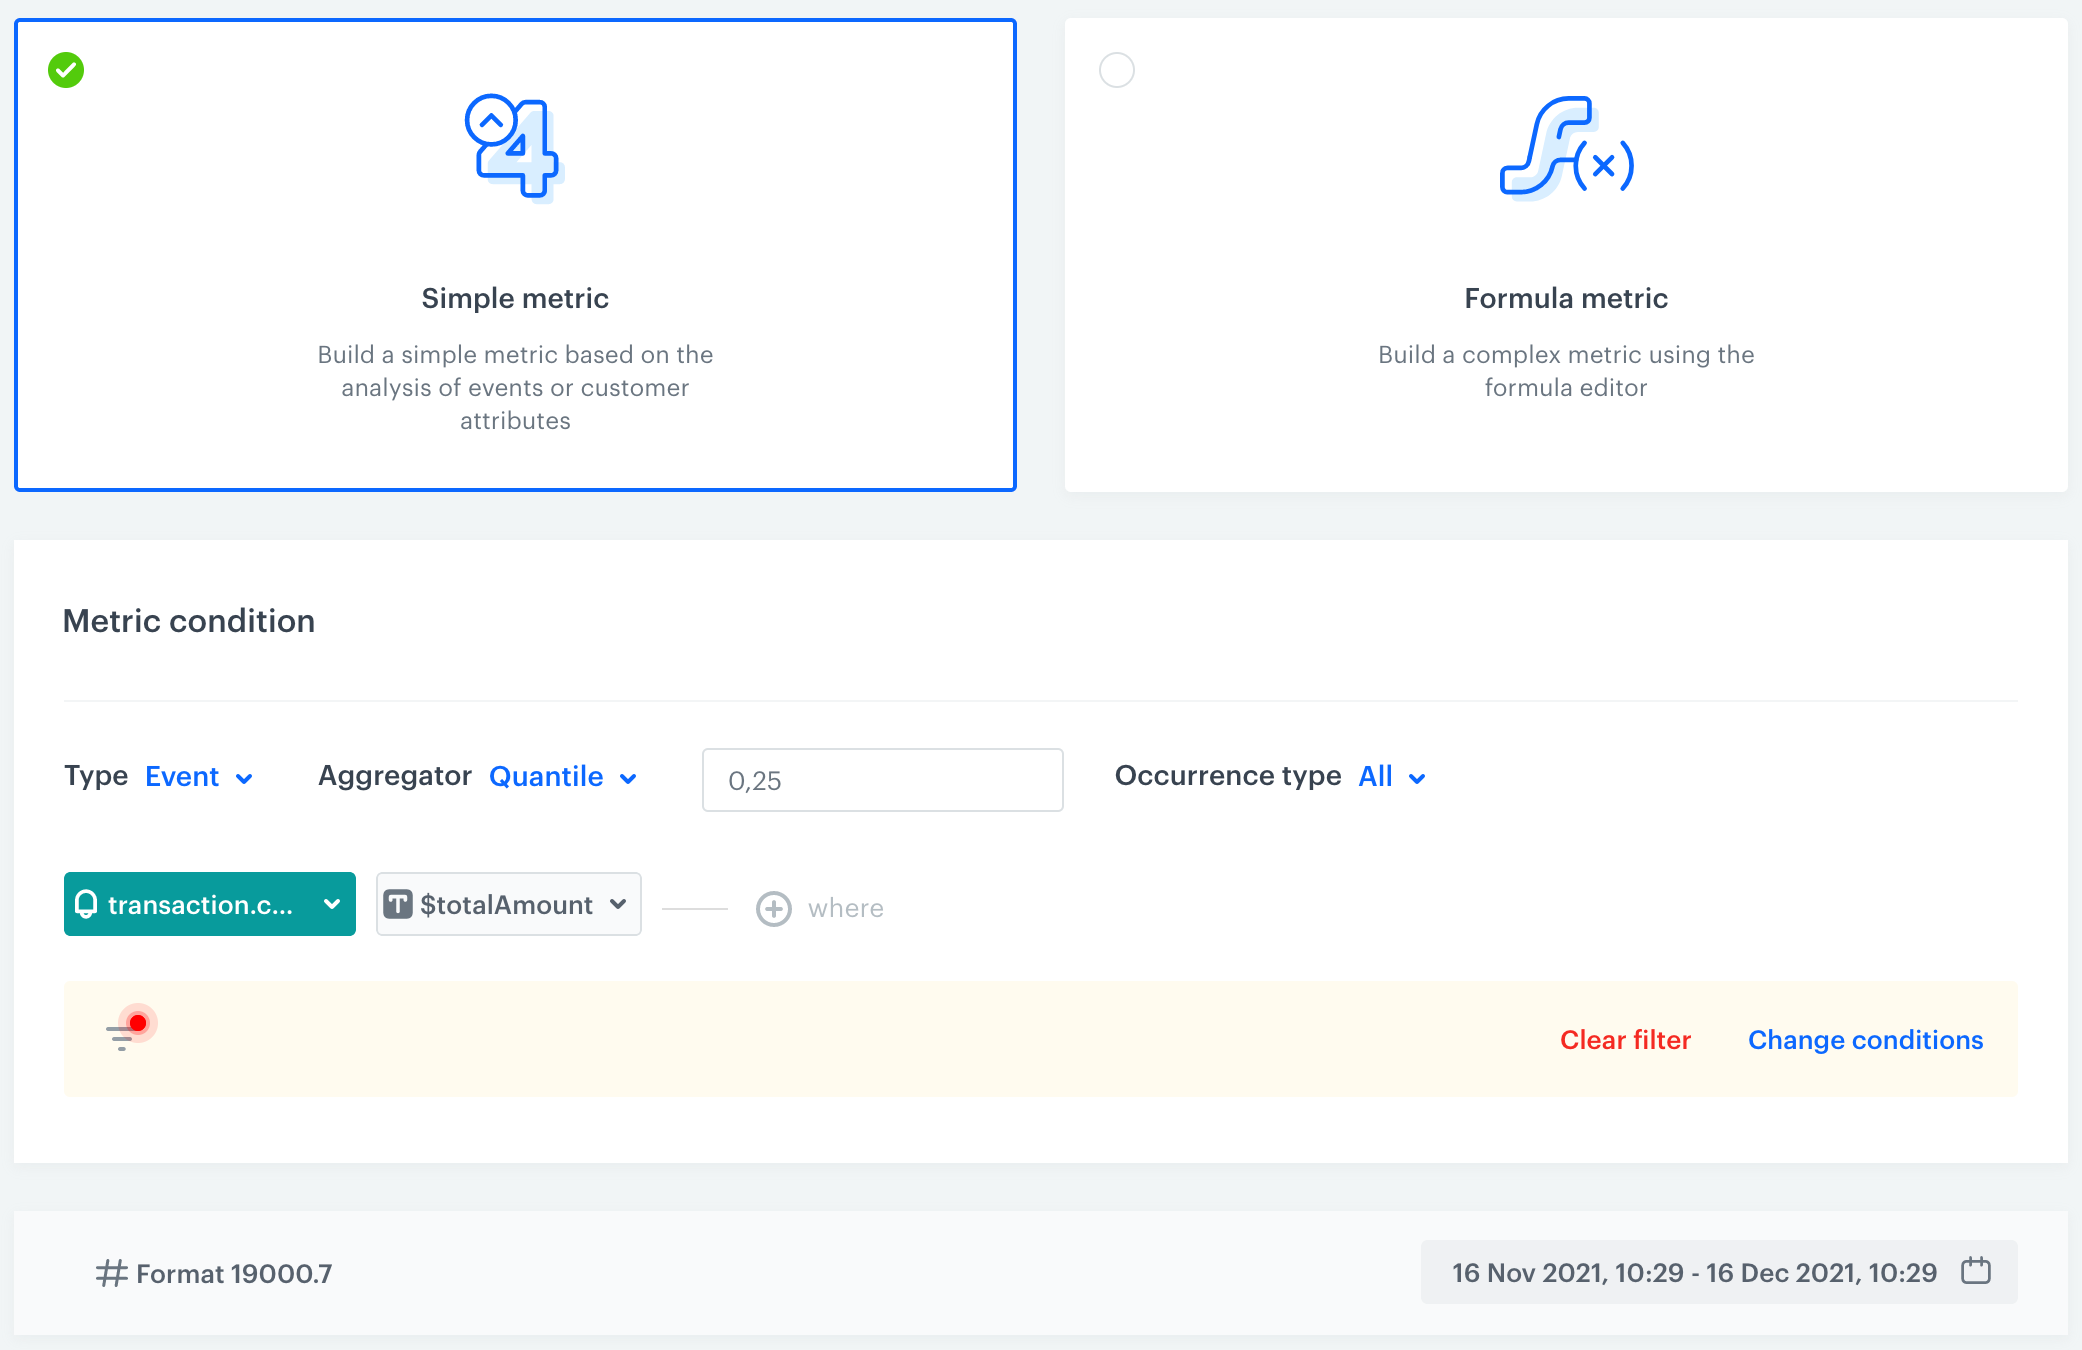
A completed quantile metric -
Create the remaining metrics:
- For females: quantiles 0.5 and 0.75, and average value (Average is one of the aggregators)
- For males: quantiles 0.25, 0.5, 0.75, and average value
- Optionally, add metrics for the
undefinedandothervalues of thesexattribute.
Tip: You can do this faster by clicking > Duplicate next to a metric in the list of metrics and then modifying the conditions in the created duplicate.
Create dashboard
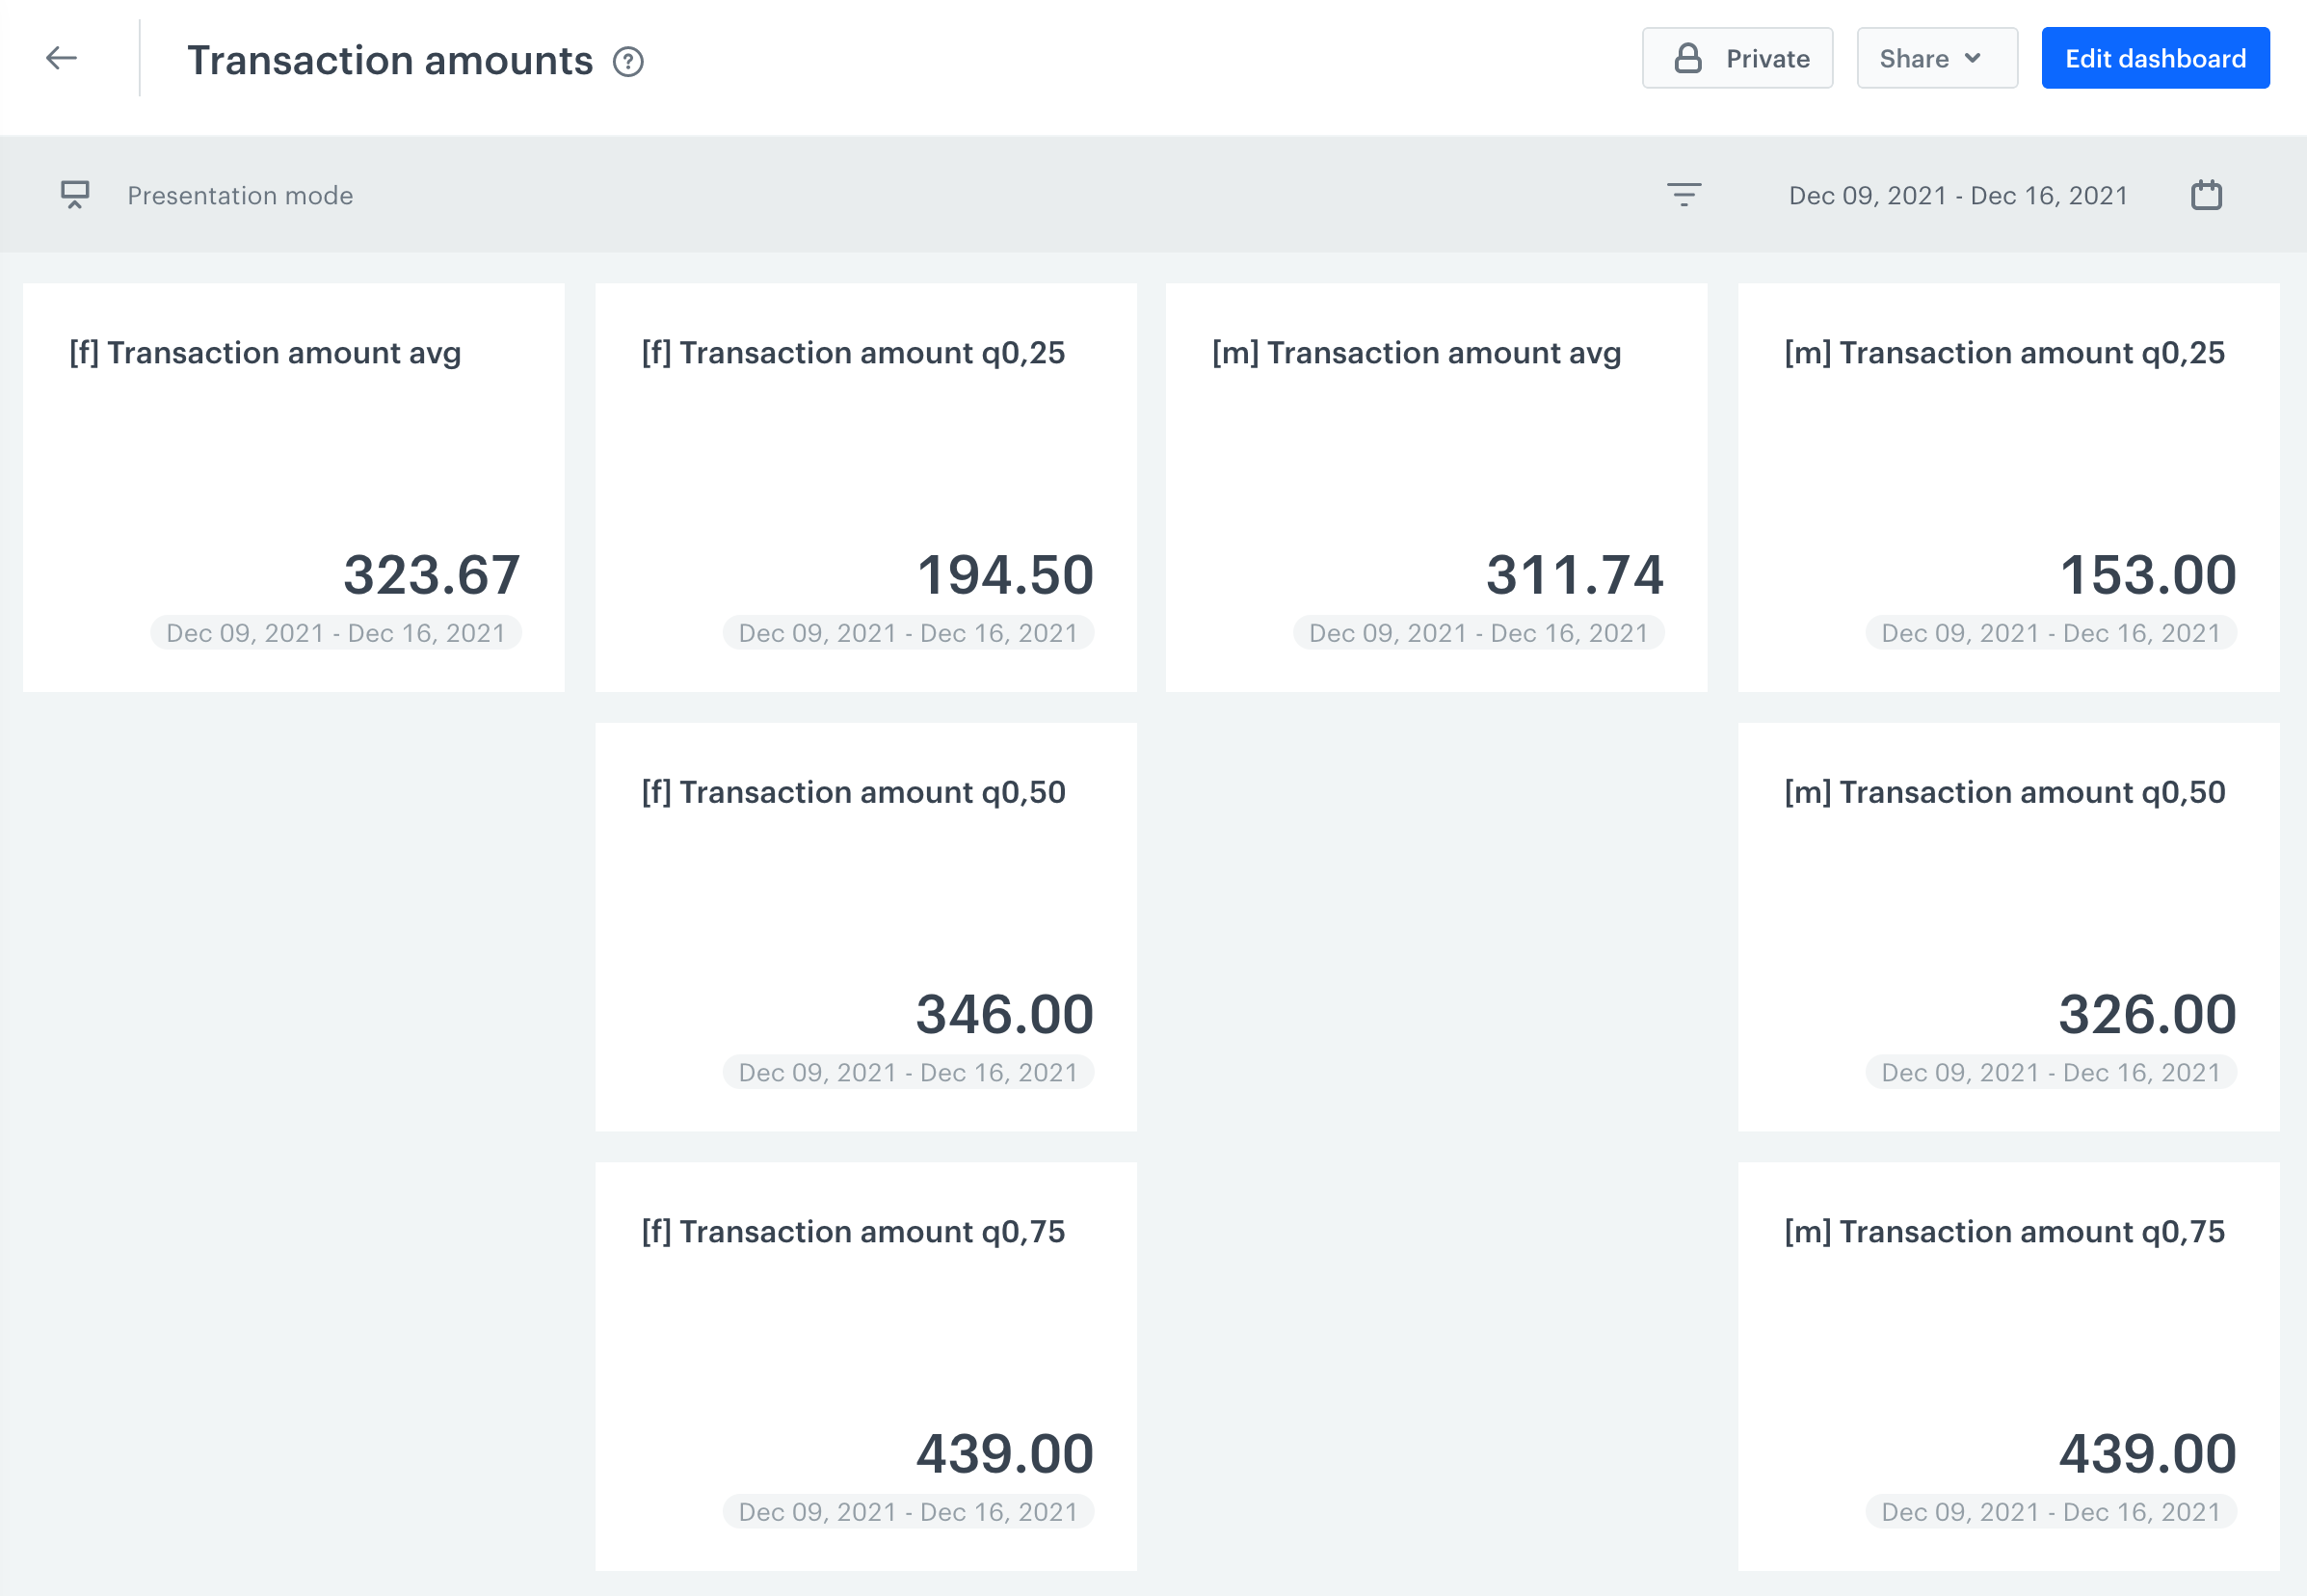
In this stage, you create a dashboard to display the results of all metrics in one place for easier analysis.
- Go to Analytics > Dashboards > Add dashboard.
- Add the metrics to the dashboard:
- Click
 .
. - Click the widget that appears.
- From the Metric drop-down list, select one of the metrics that you created previously.
- On the Tab, add two more decimal places to display (by default, none are displayed).
- Repeat steps 2a-2d until all the metrics are added.
- Click
- Click Save dashboard.
Result:
You can now open the dashboard and use the Date range picker to check data for different periods.
Check the use case set up on the Synerise Demo workspace
You can all items created in this use case in our Synerise Demo workspace:
If you don’t have access to the Synerise Demo workspace, please leave your contact details in this form, and our representative will contact you shortly.