

The most frequently clicked links in email campaigns
Synerise allows you to create a report of the most frequently clicked links in an email campaign. To display links without UTM parameters, create an expression that formula sets the logic of displaying links.
Prerequisites
- Make sure the links in the email templates contain the tracking parameters.
Process
In this use case, you will go through the following steps:
- Create a metric that calculates the occurrences of the
newsletter.clickevent. - Create an expression that will be available as a variable when including the
newsletter.clickevent in analytics. - Create a report.
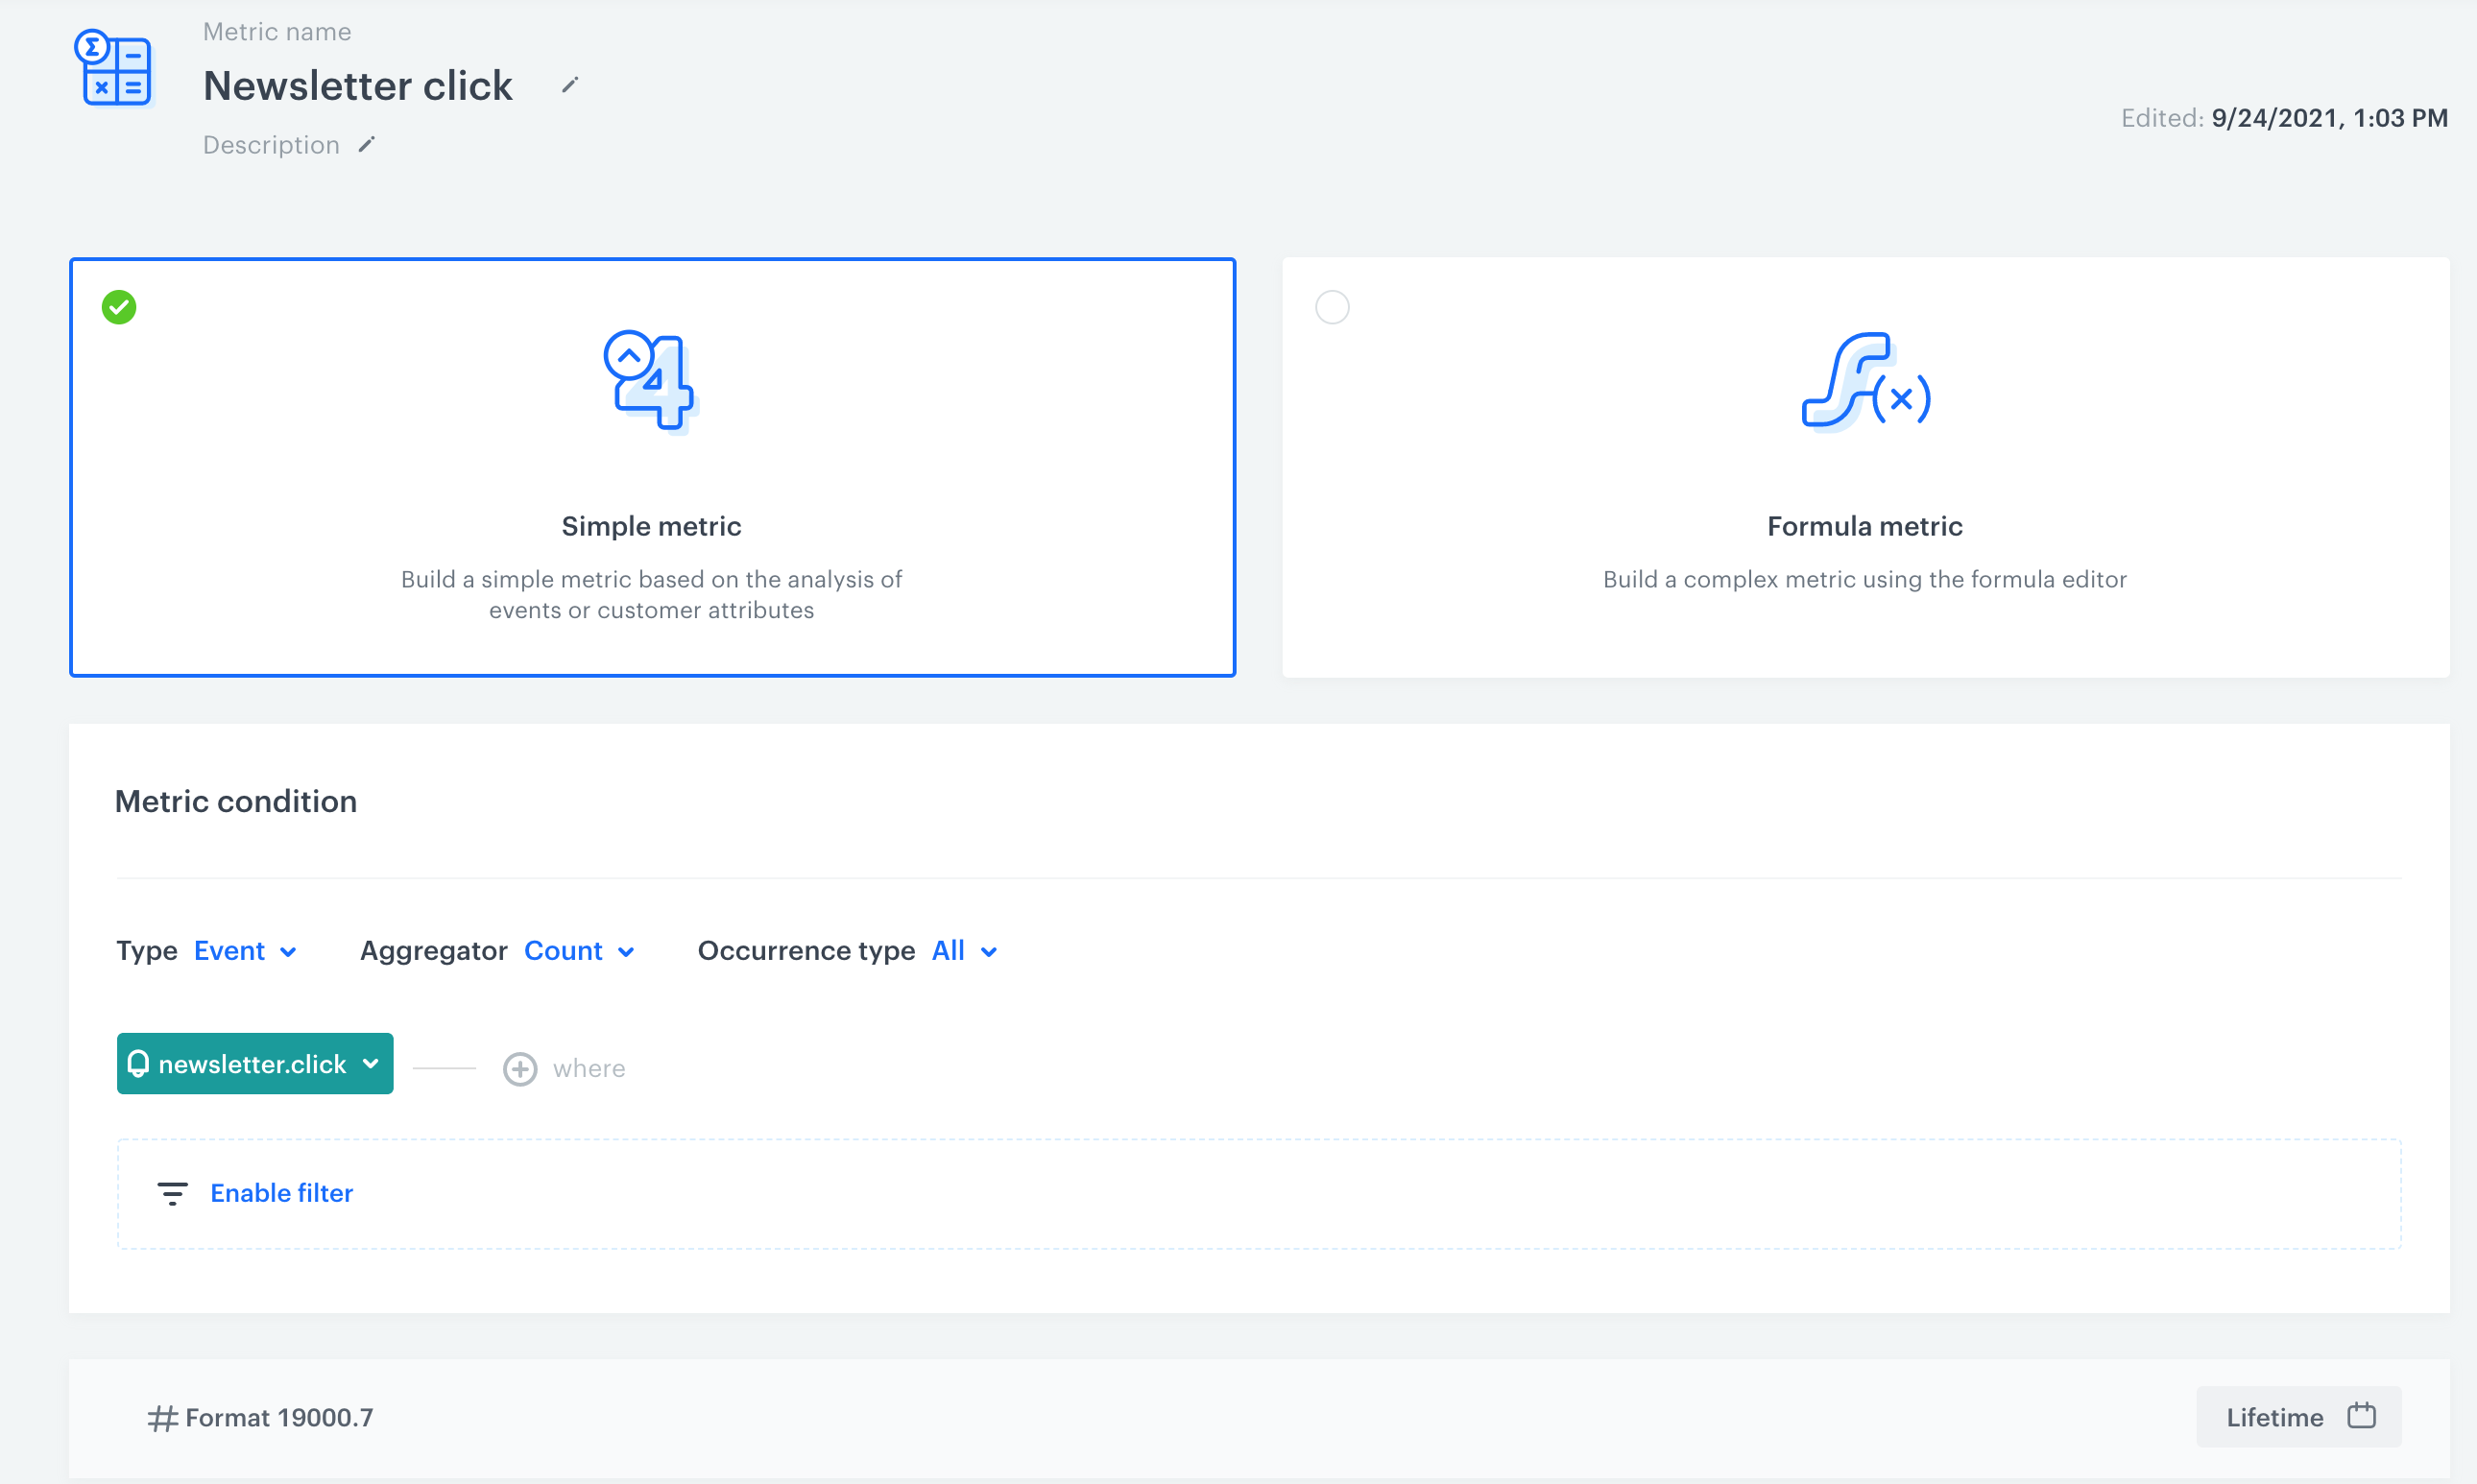
Create a metric
As the first part of the process, create a metric that calculates the occurrences of the newsletter.click event.
-
Go to
 Analytics > Metrics > New metric.
 -
Enter the name of the metric.
-
Leave the metric kind at default (Simple metric).
-
As Aggregator, select Count.
-
Leave Event and Occurrence type at default.
-
From the Choose event dropdown list, select newsletter.click.
-
As the date range, select Lifetime.
-
Click Save.
Formula of the metric
Create an expression
In this part of the process, create an expression that will be available as a variable when including the newsletter.click event in analytics. The formula of the expression contains the regular expression for the URL parameter of the newsletter.click event. As a result, the expression removes UTM parameters from the link.
- Go to Analytics > Expression > New expression.
- Enter the name of the expression.
- Set the Expression for option to Event.
- From the dropdown list, select newsletter.click.
- Build the formula of the expression:
- On the dashboard, click Select.
- From the dropdown list, select Function > Regexp.
- In the left Select field, select Event attribute.
- From the dropdown list, select url.
- In the right dropdown list, select Constant.
- Enter the following formula:
(?<=www\.|https:\/\/)[^\?\s]+(?=\?)?
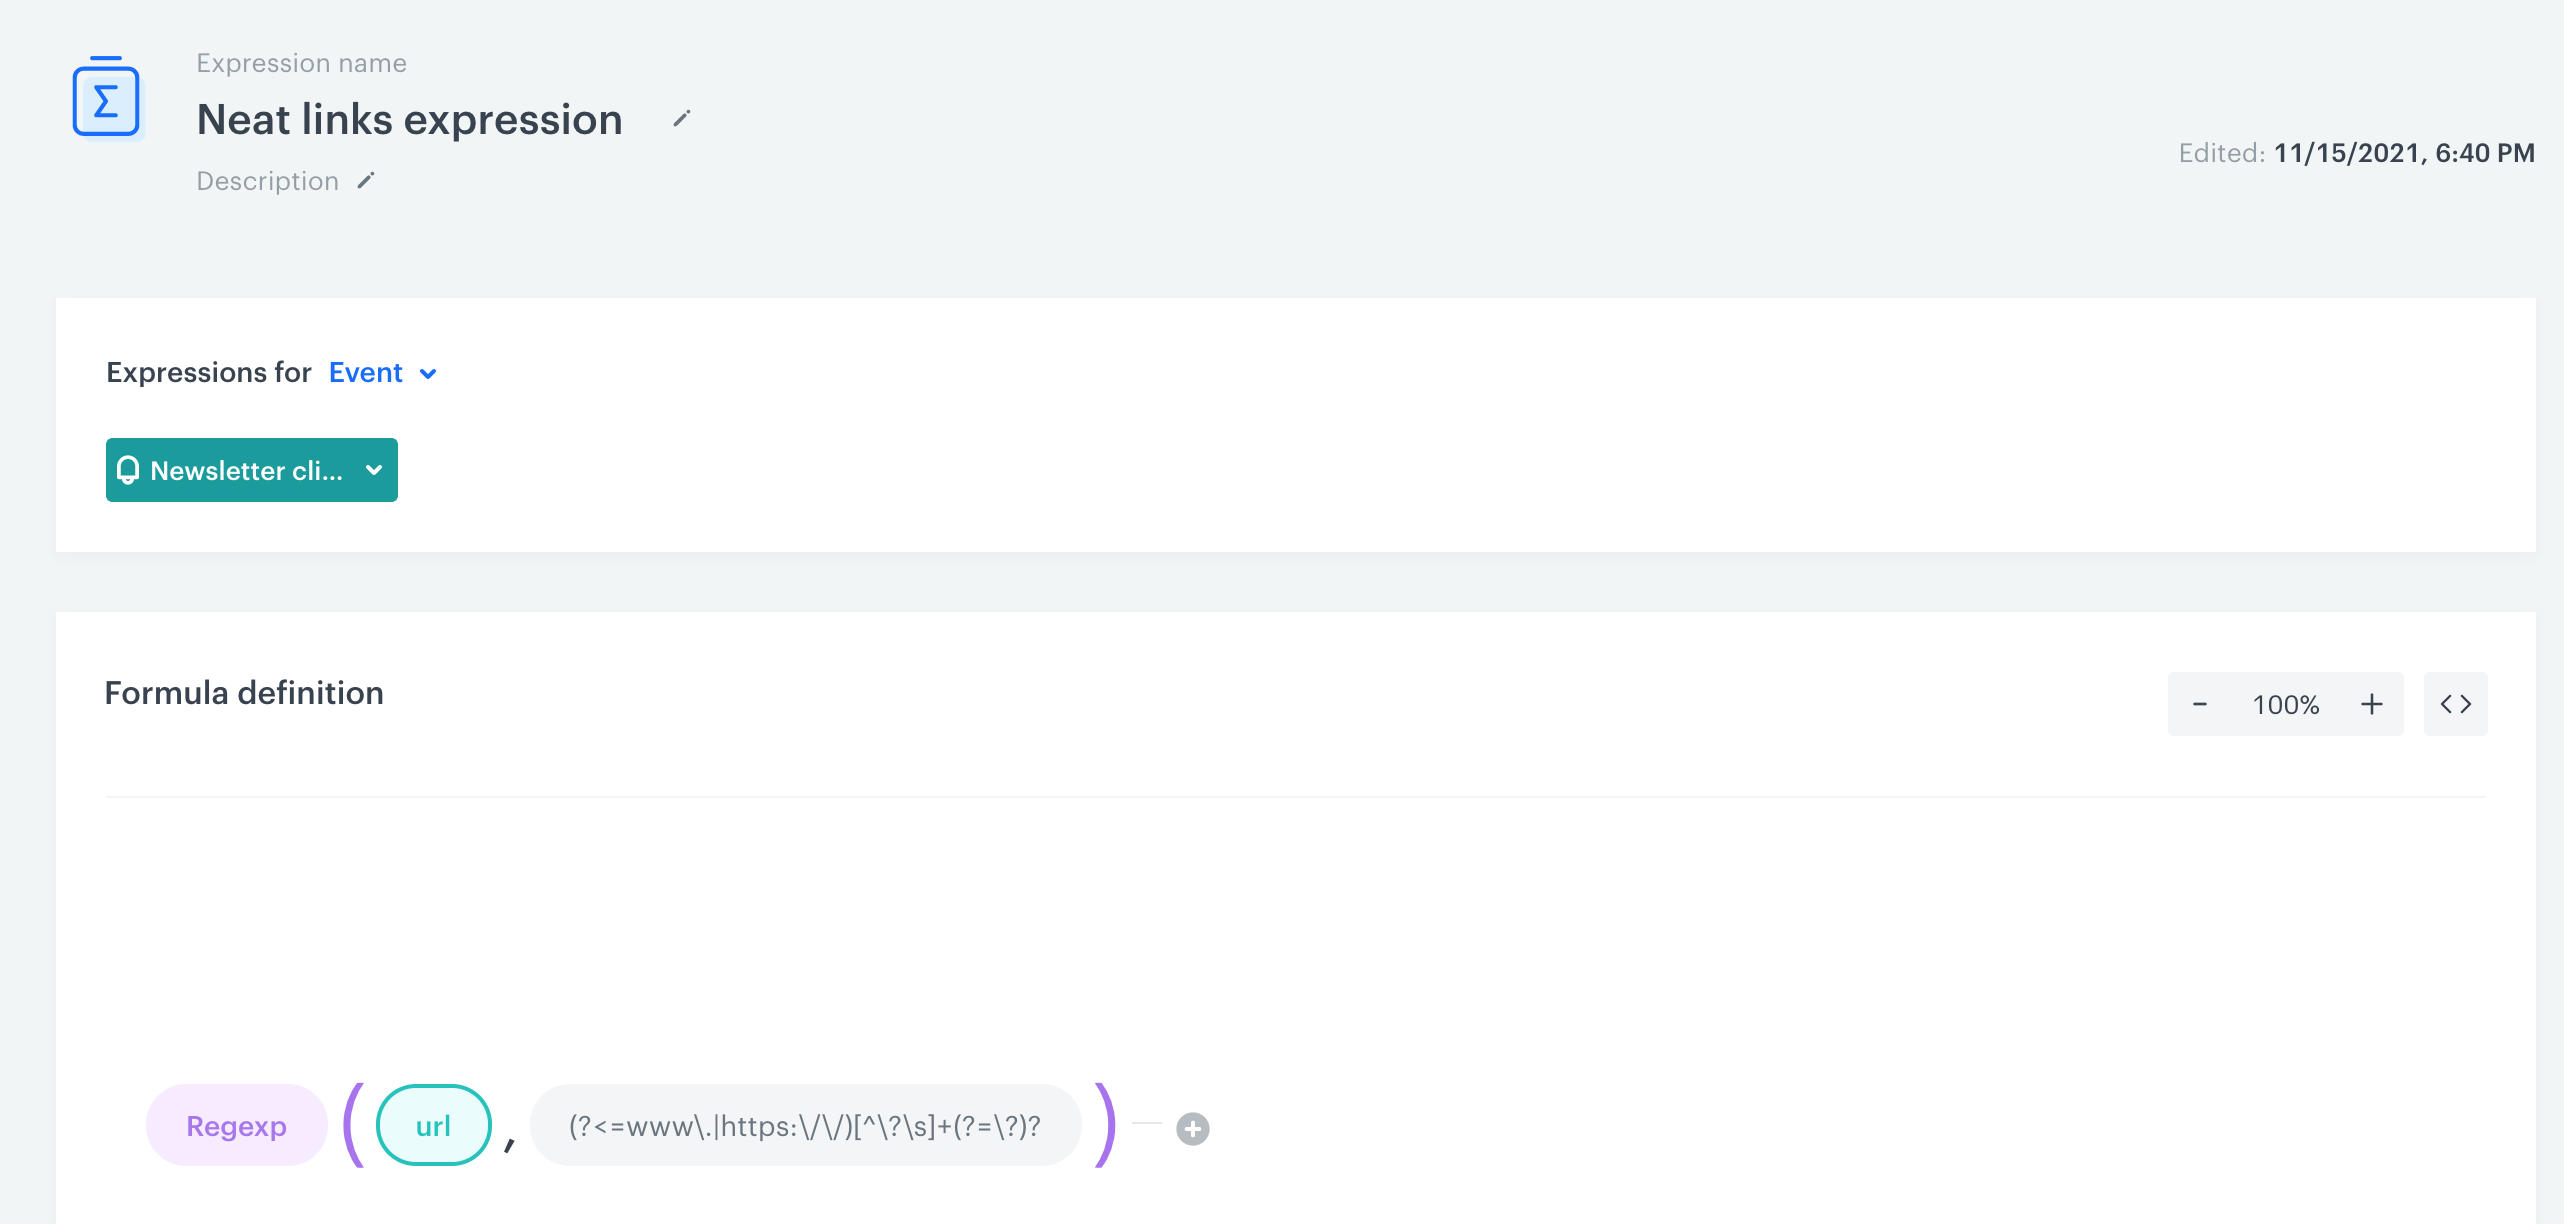
Formula of the expression - Save the expression.
Create a report
In this part of the process, create a report based on the metric and expression you prepared before. The result of the report is a table with the top/last links clicked in email campaigns and the number of clicks for each link.
- Go to Analytics > Reports > New report.
- Enter the name of the report.
- Select the metric you created in this part of the process.
- From the Range dropdown list, select the number of top (the most frequently clicked) or last (the least frequently clicked) results to be shown in the preview of the report.
- In the Dimension section, select the expression you created in this part of the process.
- In the date range, select the time that will be analyzed.
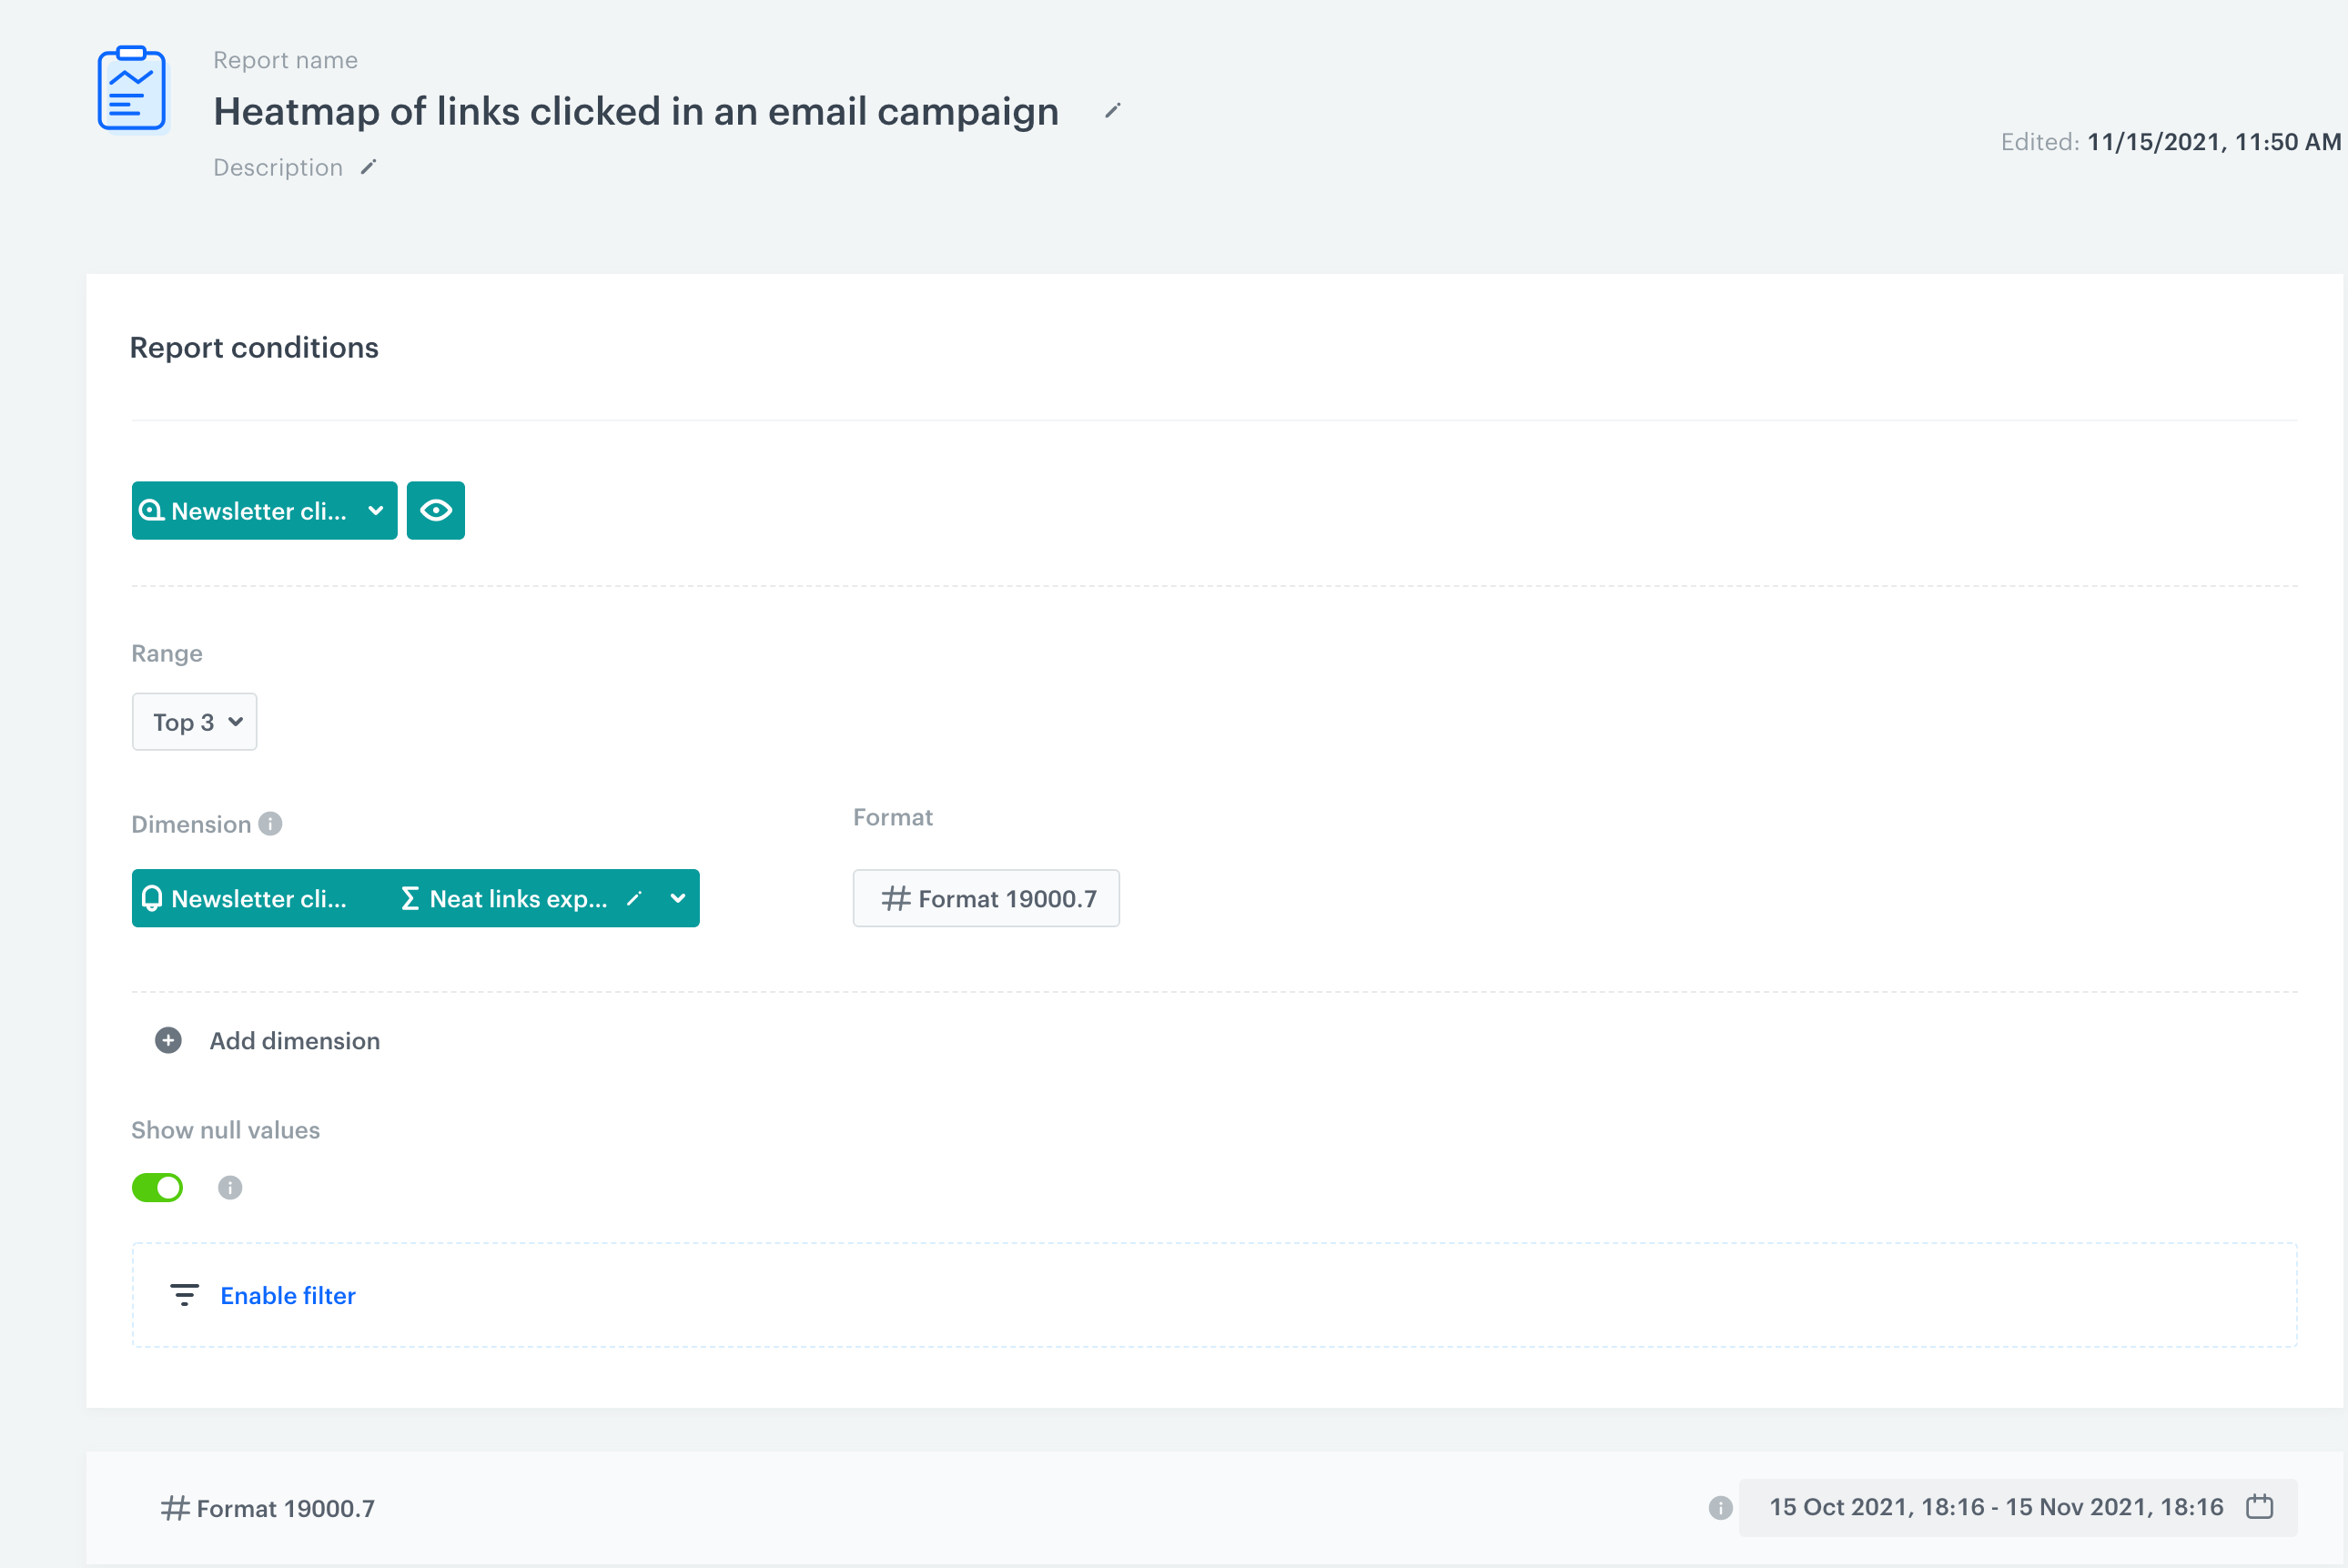
Configuration of the report - Save the report.
- Click Preview to see the results.
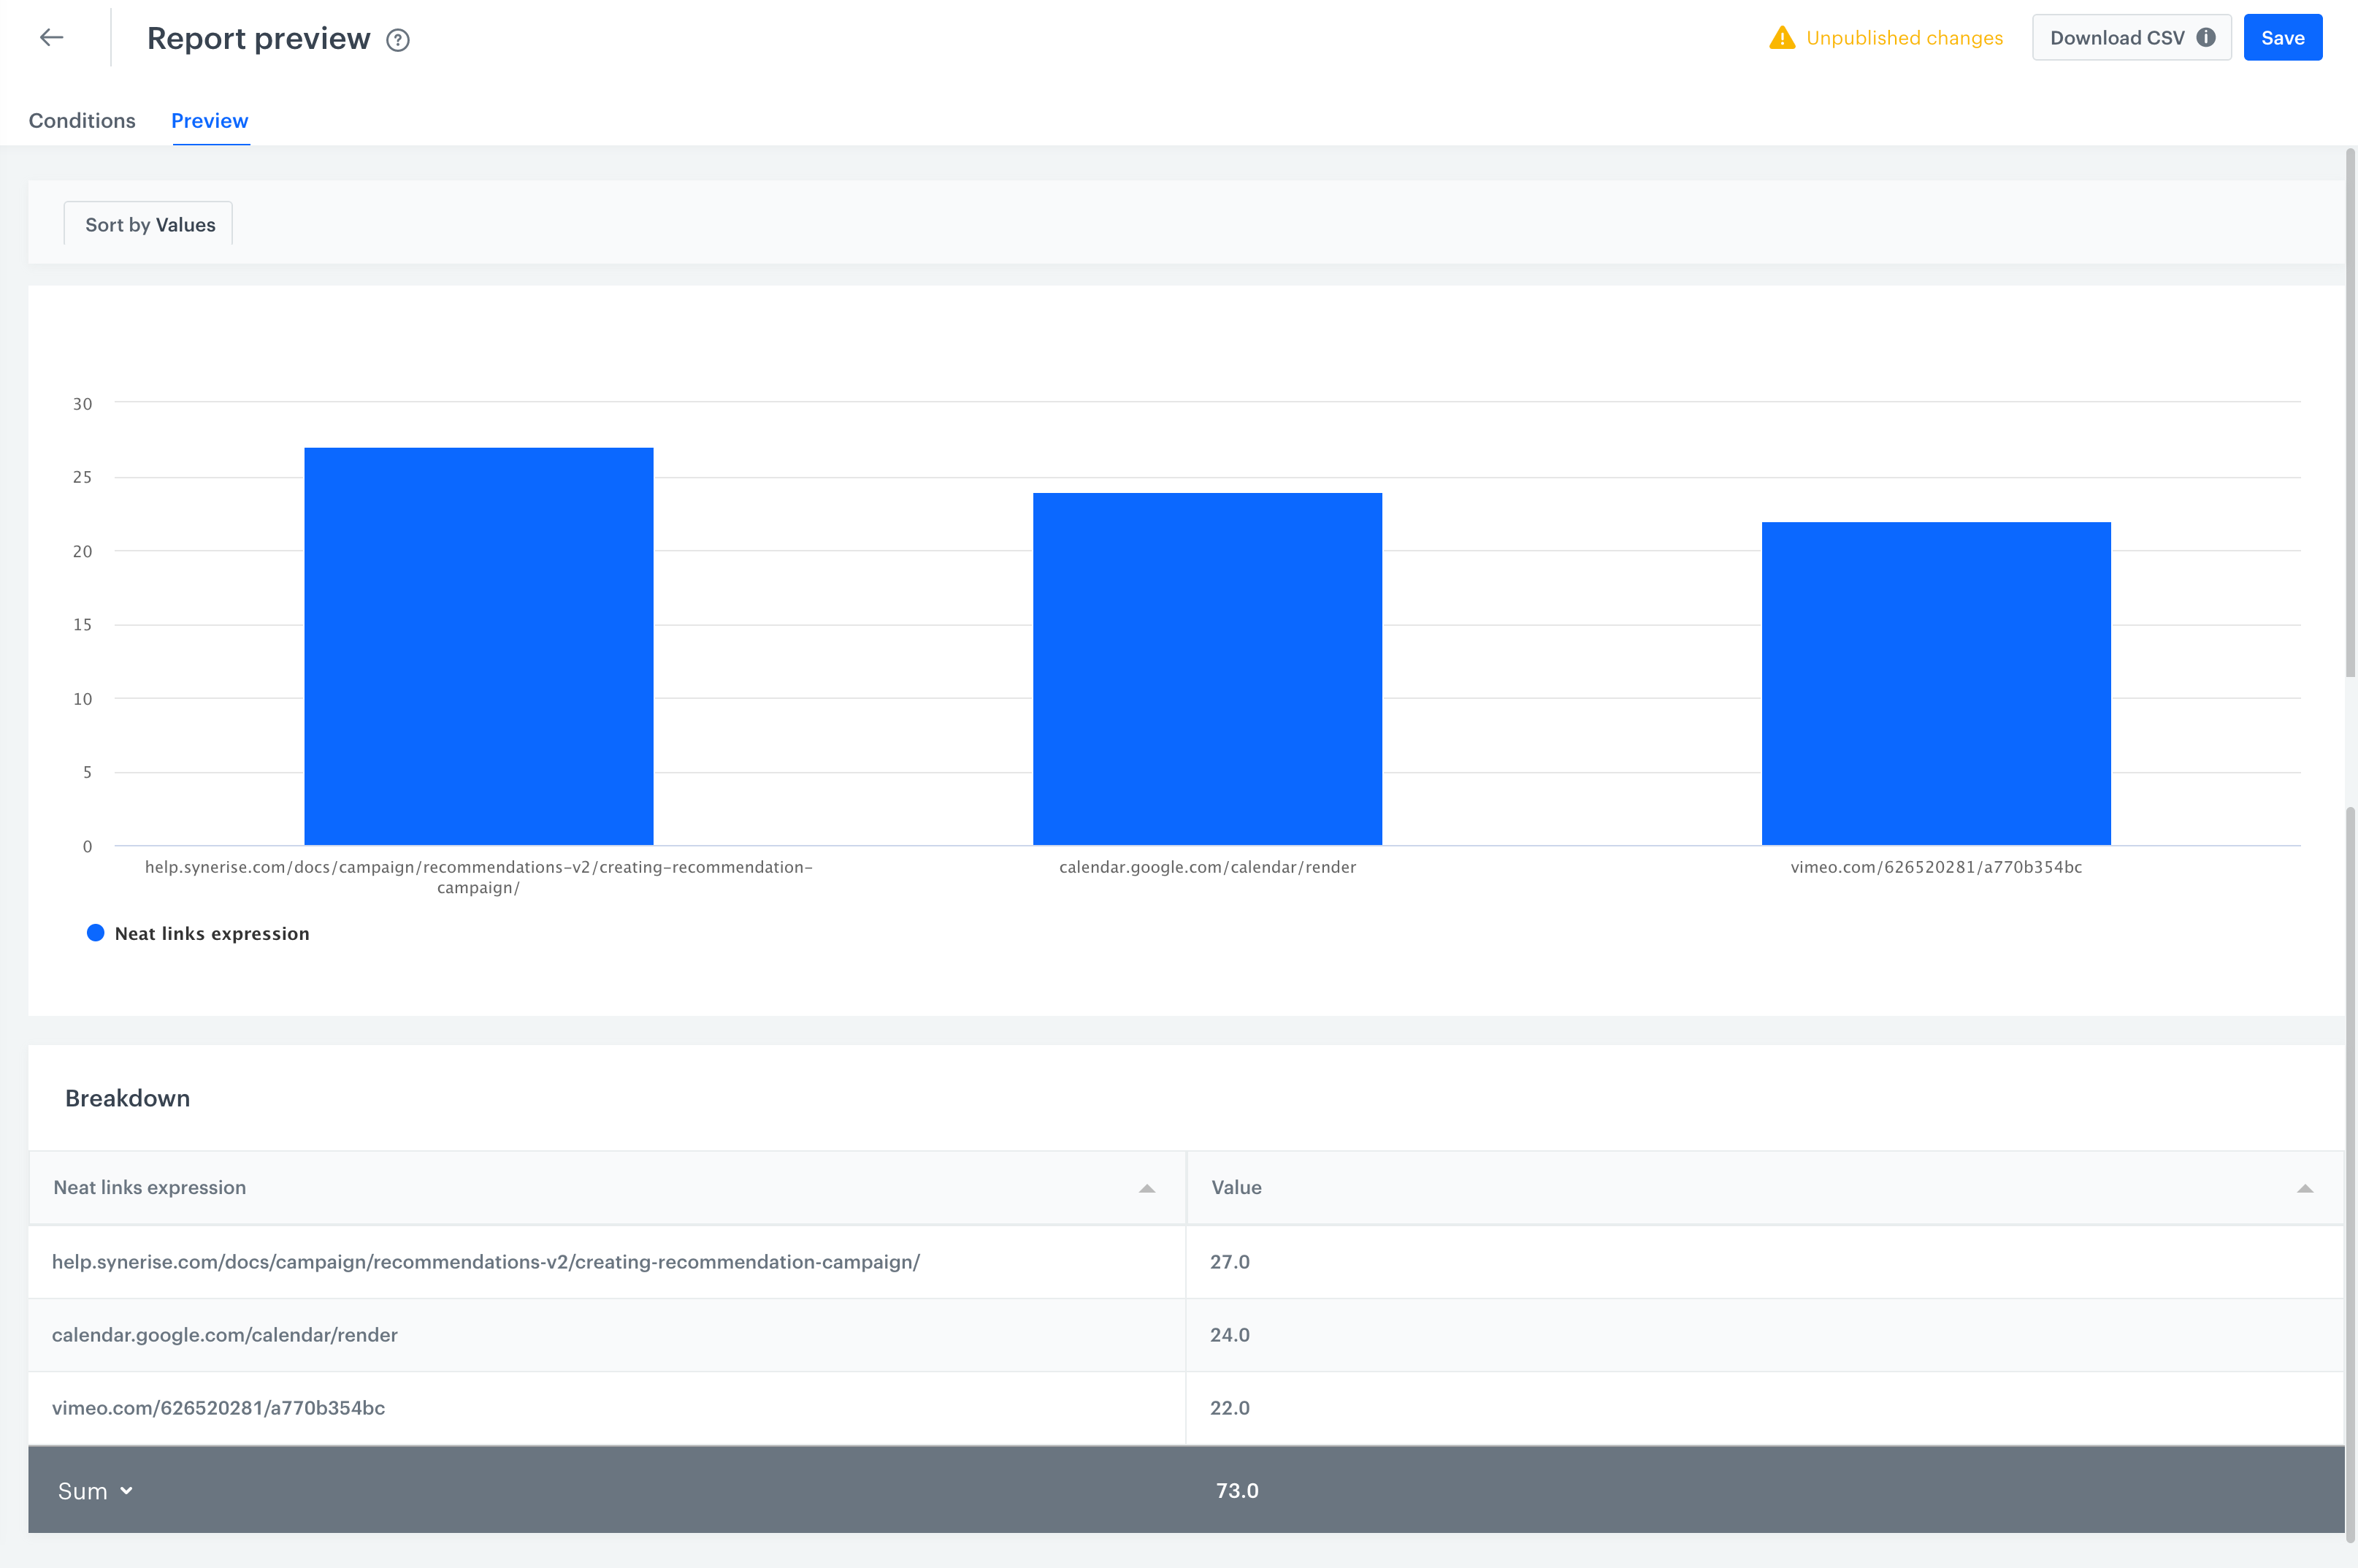
Report presents the top 3 clicked links and the number of clicks in the links
Check the use case set up on the Synerise Demo workspace
You can check the analyses created in this use case in our Synerise Demo workspace:
- Metric that returns the number of clicked links in emails.
- Expression that returns a neat link.
- Report with a heatmap of links clicked in an email.
If you don’t have access to the Synerise Demo workspace, please leave your contact details in this form, and our representative will contact you shortly.