
Dynamic report for products bought together with top 10 products
This use case is dedicated to companies seeking deeper insights into their product performance which can be achieved by automating the creation of reports of bestsellers from recent transactional data. In this use case, two reports are created:
- first, with top 10 products bought in the last 90 days,
- second, with products most often bought together in the same order with top 10 products from the last 90 days.
The reports will show which products are often purchased together with bestsellers, helping the company make decisions about inventory, marketing, and customer preferences.
The process starts with creating an aggregate that returns the list of 1000 IDs of orders from the last 90 days. Then, you will proceed to creating two metrics: the first one calculates the total quantity of purchased products over the last 90 days, the second metric sums the quantity of products purchased within the order IDs returned by the aggregate created earlier. This way, you will identify frequently co-purchased items. Based on those metrics, you will create reports mentioned before.
As the final part of the process, you will create a workflow that retrieves data from those reports and once a day updates the aggregate, metrics, and reports with the current data. This ensures that all analyses remain up to date everyday. Through this process, the company can effectively monitor product performance, identify trends, and strategize based on data-driven insights. This not only streamlines decision-making but also empowers the company to stay competitive in a dynamic market landscape.
To conveniently monitor and visualize results, a dashboard is created, showing both the bestsellers report and the dynamic report.
Prerequisites
- Implement a tracking code into your website.
- Import a product feed to a catalog.
- Import transaction events.
- Enrich transactional data from your product feed.
- Create a Workspace API key with following permissions:
ANALYTICS_BACKEND_METRIC_UPDATE,ANALYTICS_BACKEND_AGGREGATE_UPDATE,ANALYTICS_BACKEND_REPORT_READ.
Process
In this use case, you will go through the following steps:
- Create an aggregate that returns a list of order IDs in the last 90 days.
- Create a metric that returns the quantity of purchased products in the last 90 days.
- Create a metric that returns the quantity of purchased products in the specific order.
- Create a report with top 10 bestsellers based on the metric that returns the quantity of purchased products in the last 90 days.
- Create a dynamic report with top 10 complementary products to 10 bestsellers.
- Create a workflow which retrieves and updates the analyses created in the previous parts of the process.
- Create a dashboard with two reports created earlier.
Create an aggregate
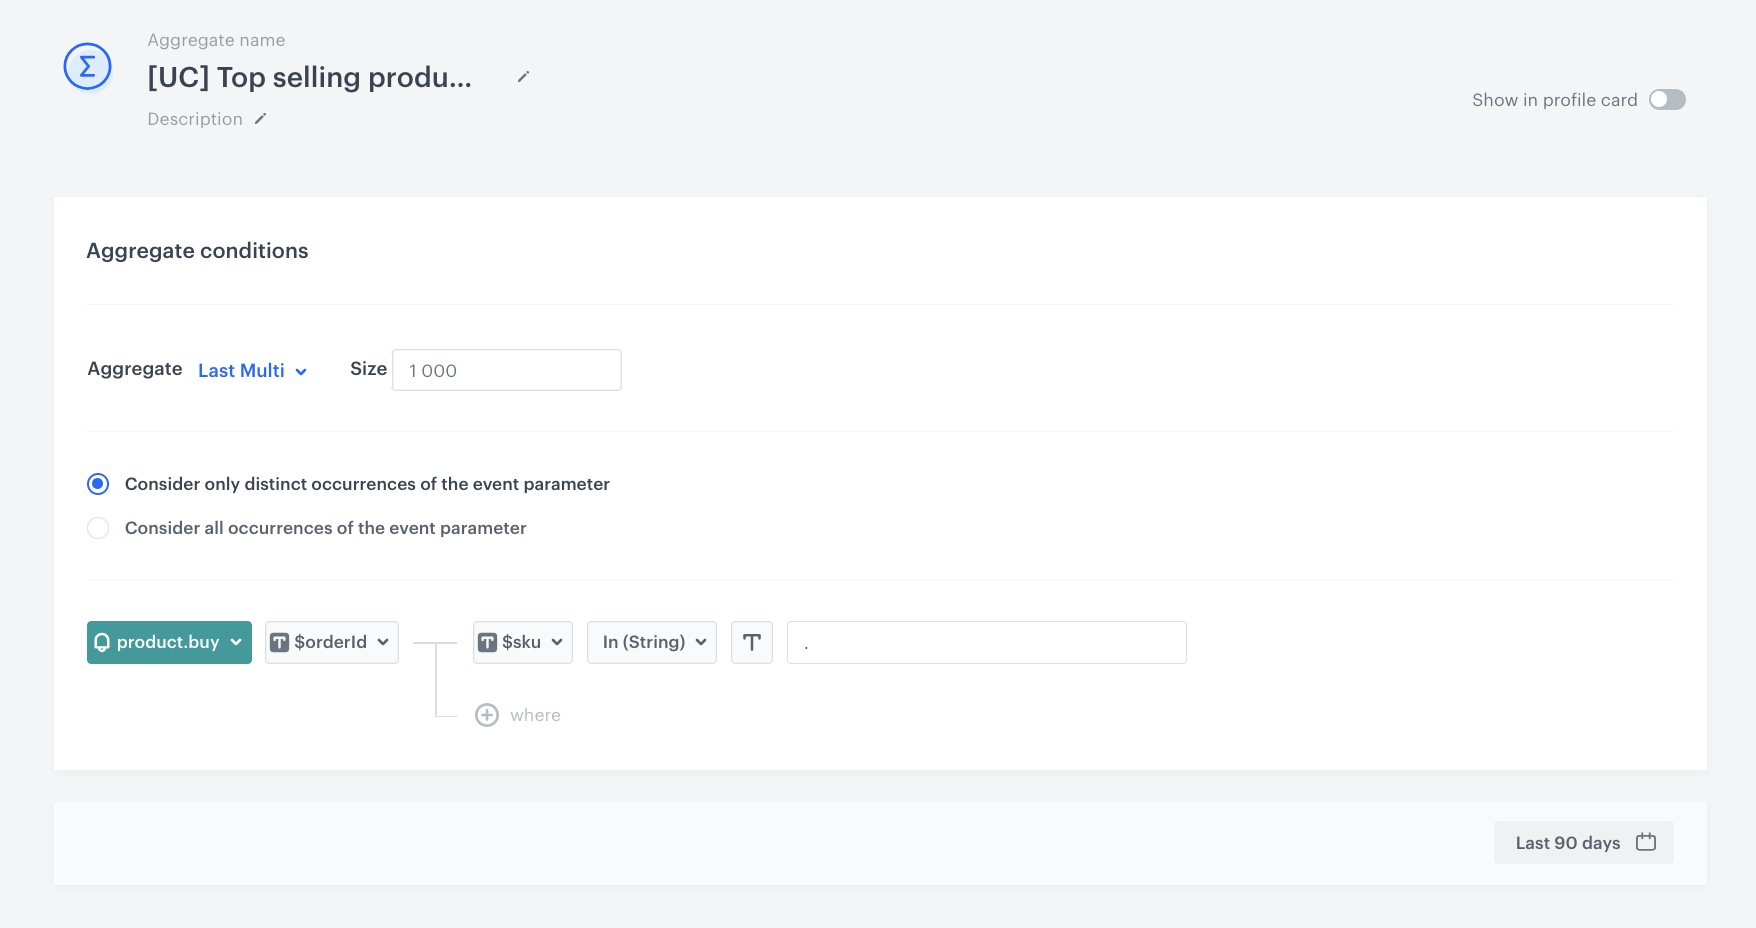
The first step is creating an aggregate that returns IDs of the last 1000 orders which included products from a pre-defined list which will be updated later in the workflow.
- Go to
 Analytics > Aggregates > New aggregate.
 - Enter the name of the aggregate.
- As the type of the aggregate, select Last multi and in the Size field, enter
1000.Note: The number of last multi should be chosen depending on the specific company’s sales volume. - Select the Consider only distinct occurrences of the event parameter button.
- From the Choose event dropdown list, select the product.buy event.
- As the event parameter, select $orderId.
- Click + where button.
- From the Choose parameter dropdown list, select the $sku parameter.
- From the Choose operator dropdown list, select In (stirng).
- Enter the
.character. This value will be updated later through a workflow created in the further part of the process. - Set the period from which the aggregate will analyze the results. In our case, it’s last 90 days.
- Save the aggregate.
Create a metric that returns the quantity of purchased products
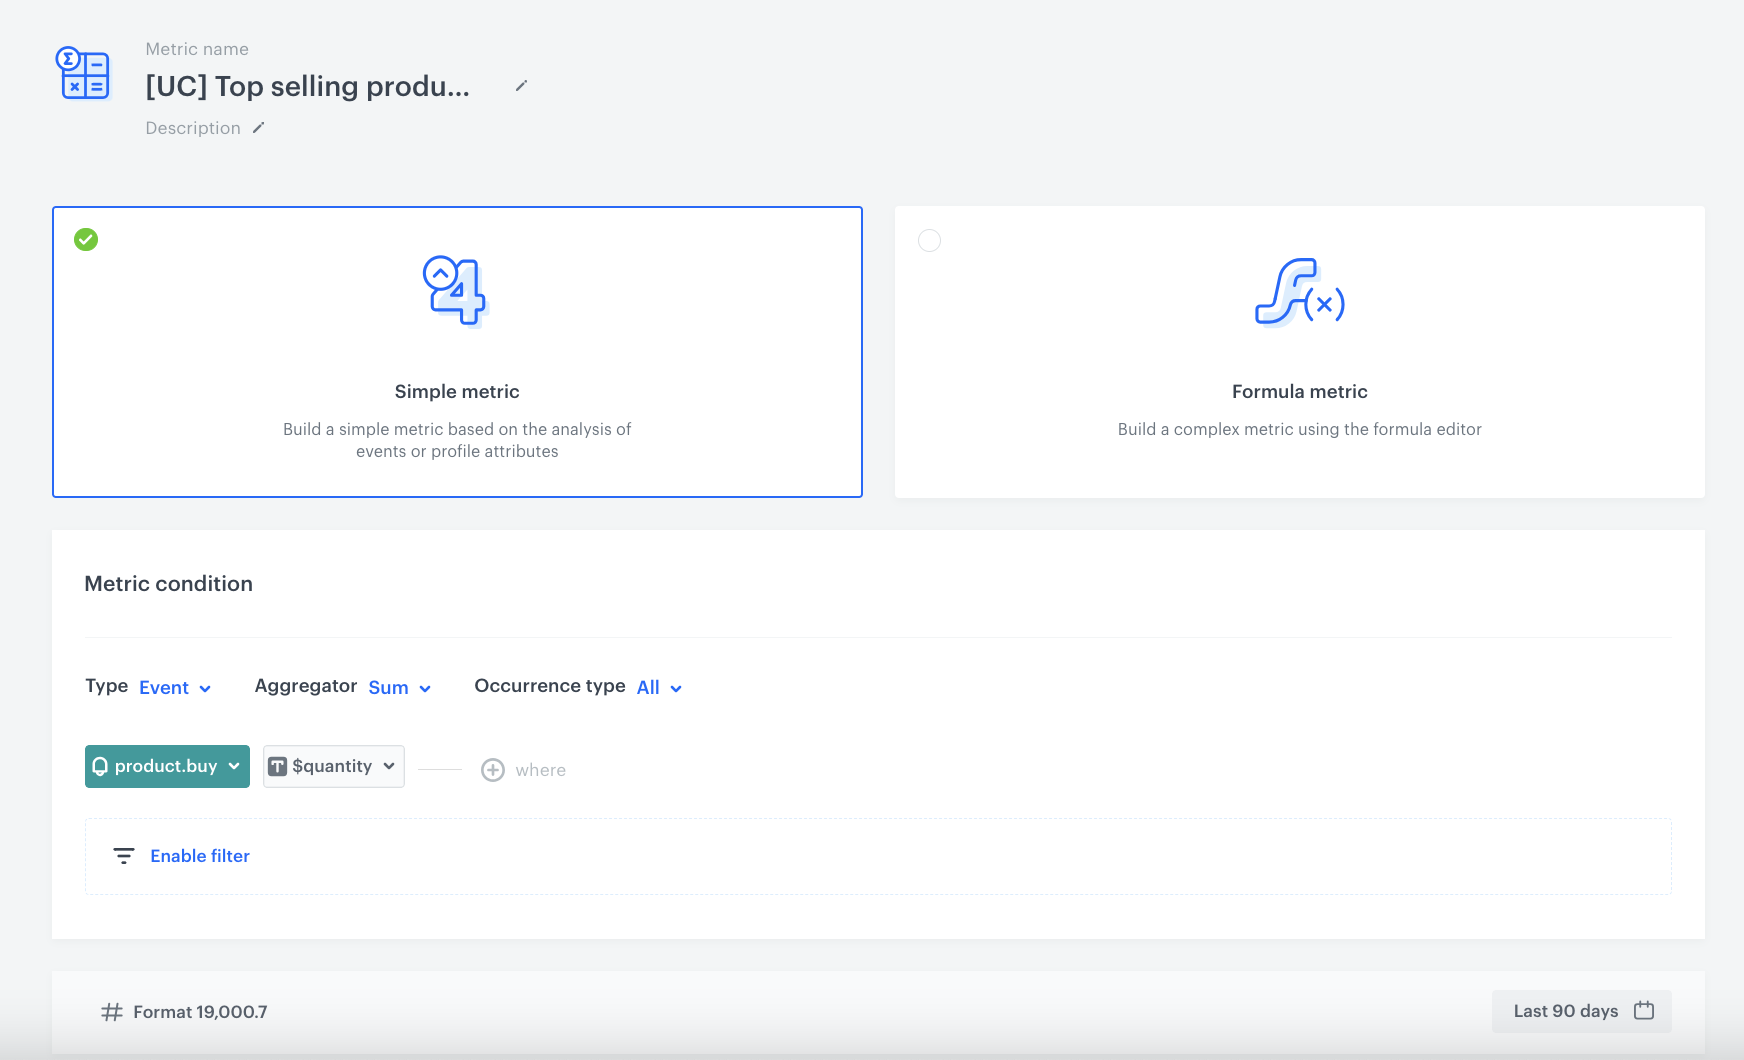
The next step involves creating a metric that calculates the total sum of purchased items. This simple metric, which considers all occurrences of the product.buy event in the last 90 days, will be used in the report which will give you insights into the most frequently purchased products in the defined time frame (in our case - last 90 days).
- Go to Analytics > Metrics > New metric.
- Enter the name of the metric.
- As the kind of the metric, select Simple metric.
- As the aggregator, set Sum.
- As the occurrence type, set All.
- From the Choose event dropdown list, select the product.buy event.
- Click the Where button.
- Click the Choose parameter button.
- Choose the $quantity parameter.
- To specify the analyzed period, click the calendar icon.
- Choose the last 90 days.
- Confirm your selection by clicking the Apply button.
- Save the metric.
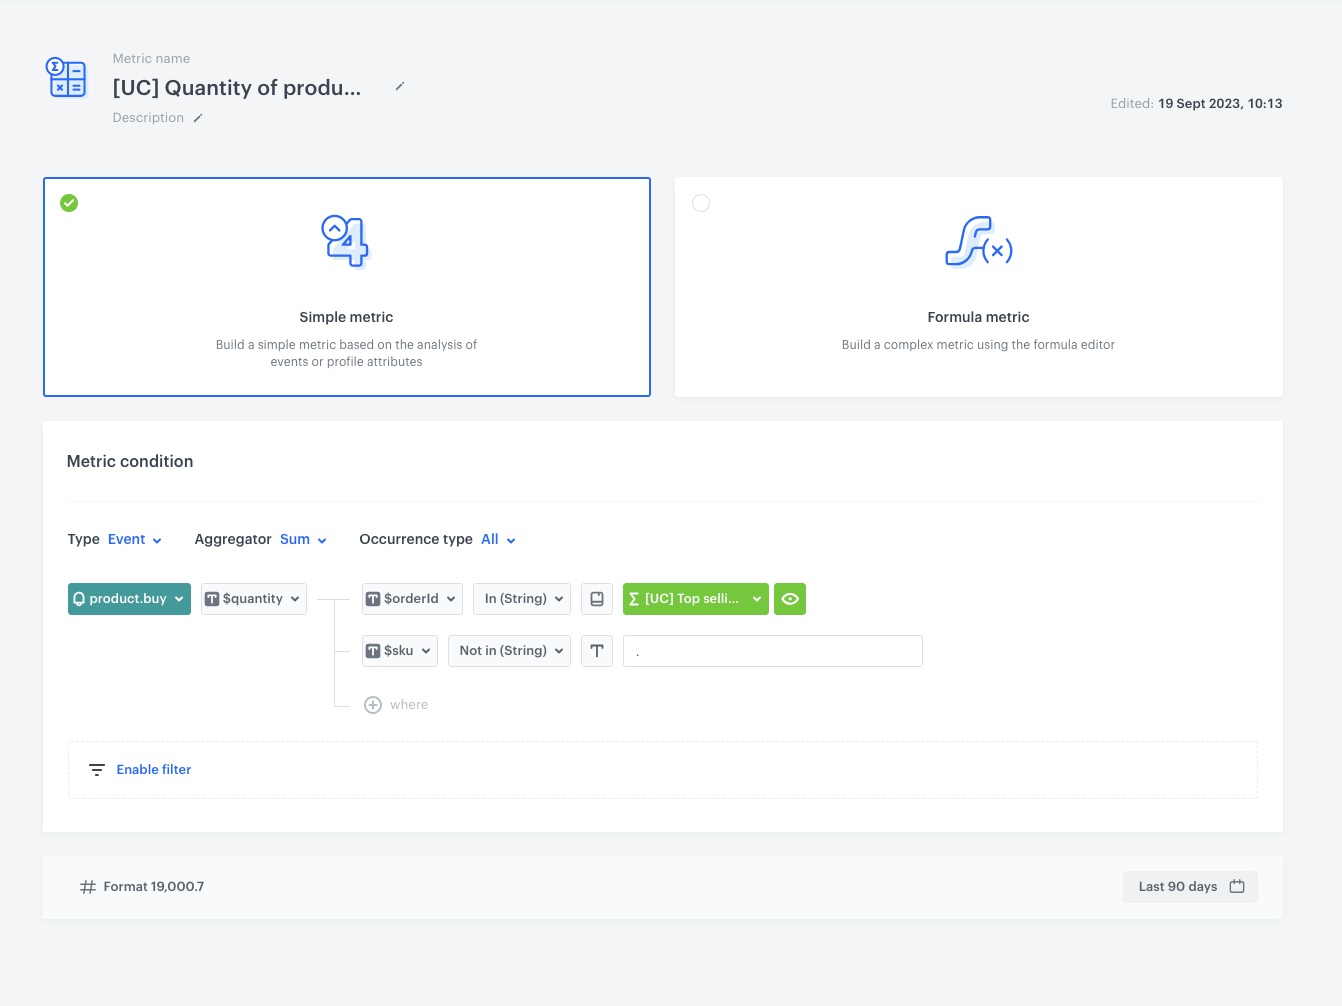
Create a metric that returns the quantity of purchased products in the specific order
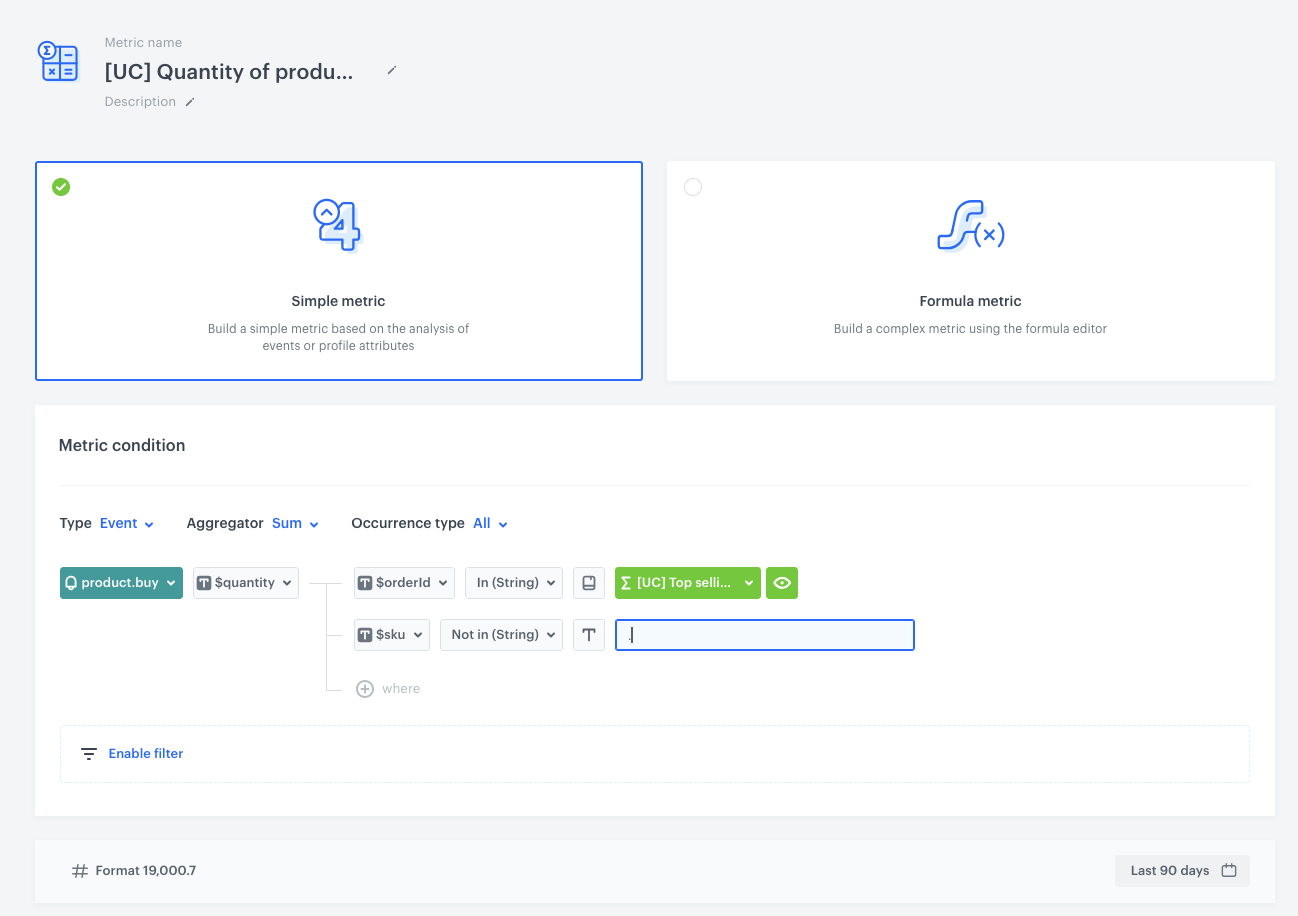
In this part of the process, create a metric that returns the quantity of products purchased within specific order IDs. This metric is essential for grouping together products bought in the same order. Later it will be used to identify frequently co-purchased items. This metric will not return results until the workflow, which will be created in the further part of the process, is launched.
- Go to Analytics > Metrics > New metric.
- Enter the name of the metric.
- As the kind of the metric, select Simple metric.
- As the aggregator, set Sum.
- As the occurrence type, set All.
- From the Choose event dropdown list, select the product.buy event.
- As a parameter choose $quantity.
- Click the Where button.
- Click the Choose parameter button.
- Choose the $orderId parameter.
- As an operator select, In (String).
- As a value of the
$orderIdparameter, select an aggregate created in the previous step. - Click the +where button.
- From the dropdown, select the parameter $sku.
- As an operator, select Not in (String).
- As the value, enter the
.sign. This value will be updated later through a workflow created in the further part of the process. - Set the period from which the metric will analyze the results. In our case Last 90 days.
- Confirm your selection by clicking the Apply button.
- Save the metric.
Create a report
In this part of the process, you will create a report that returns the top 10 bestselling products from the last 90 days. This report helps you understand which products are performing exceptionally well, providing insights for inventory management and marketing strategies.
- Go to Analytics > Report > New report.
- Enter a name of the report.
- Select the metric you created in the previous part of the process.
- From the Range dropdown list, choose 10 top.
- In the Dimension section, from the product.buy event, select $sku to display the SKU of each product included in the report results.
- In the Dimension section, from the product.buy event, select $name to display the name of each product included in the report results.
- For the date range, select the time period you want to analyze. In this case, choose last 90 days.
- Save the report.
- Click on Preview to view the results.
Create a dynamic report
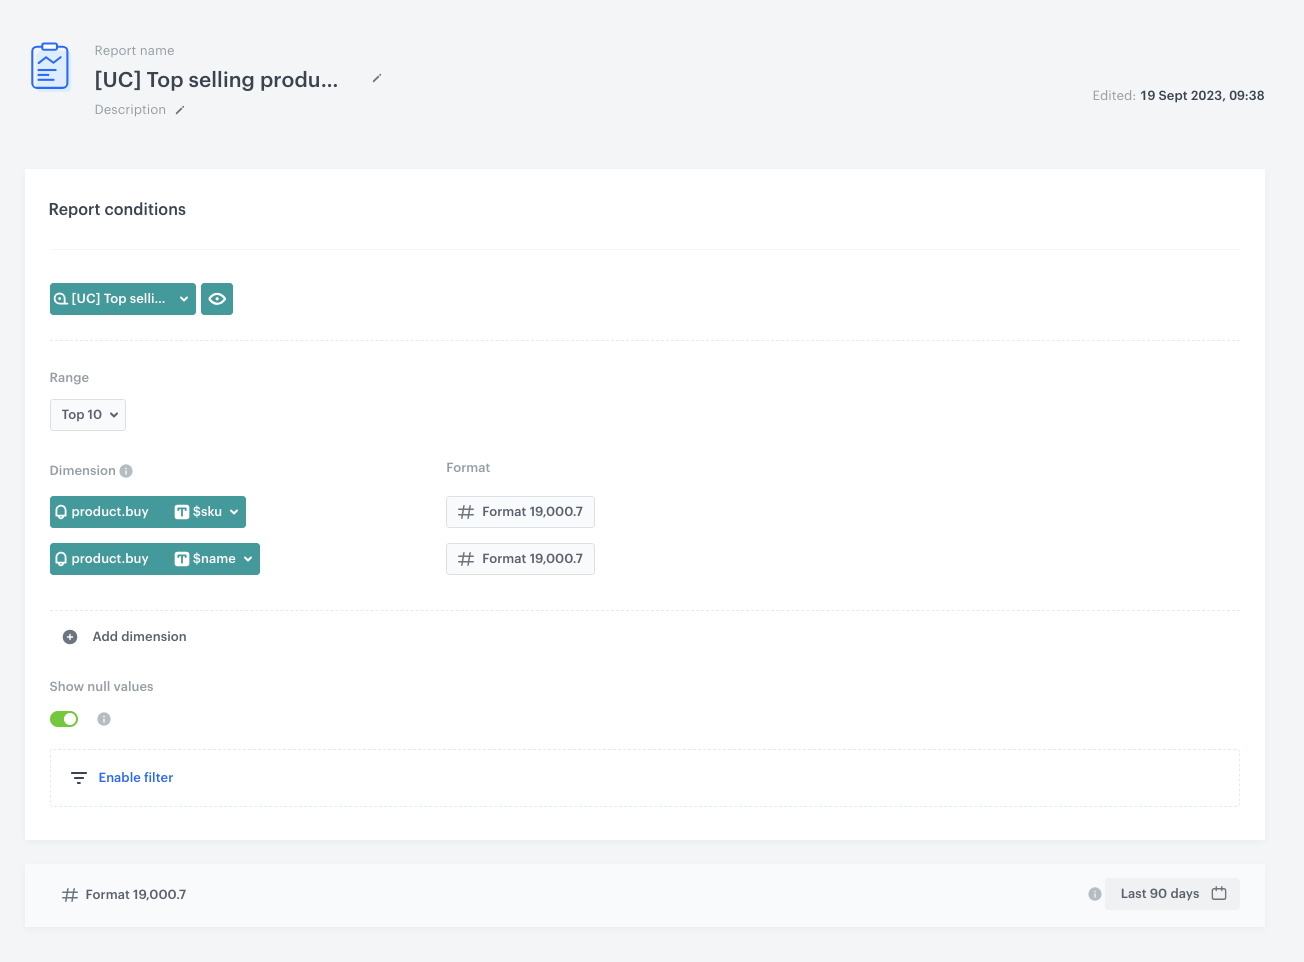
This report identifies the top 10 products most frequently bought together with the bestselling products from the last 90 days. This dynamic report relies on the metric created in the previous step and lets you uncover complementary products. This report will not return results until the workflow, which will be created in the further part of the process, is launched.
- Go to Analytics > Report > New report.
- Enter a name of the report.
- Select the metric you created in the previous part of the process.
- From the Range dropdown list, choose 10 top.
- In the Dimension section, from the product.buy event, select $sku to display the SKU of each product included in the report results.
- In the Dimension section, from the product.buy event, select $name to display the name of each product included in the report results.
- For the date range, select the time period you want to analyze. In this case, choose last 90 days.
- Save the report.
- Click Preview to view the results.
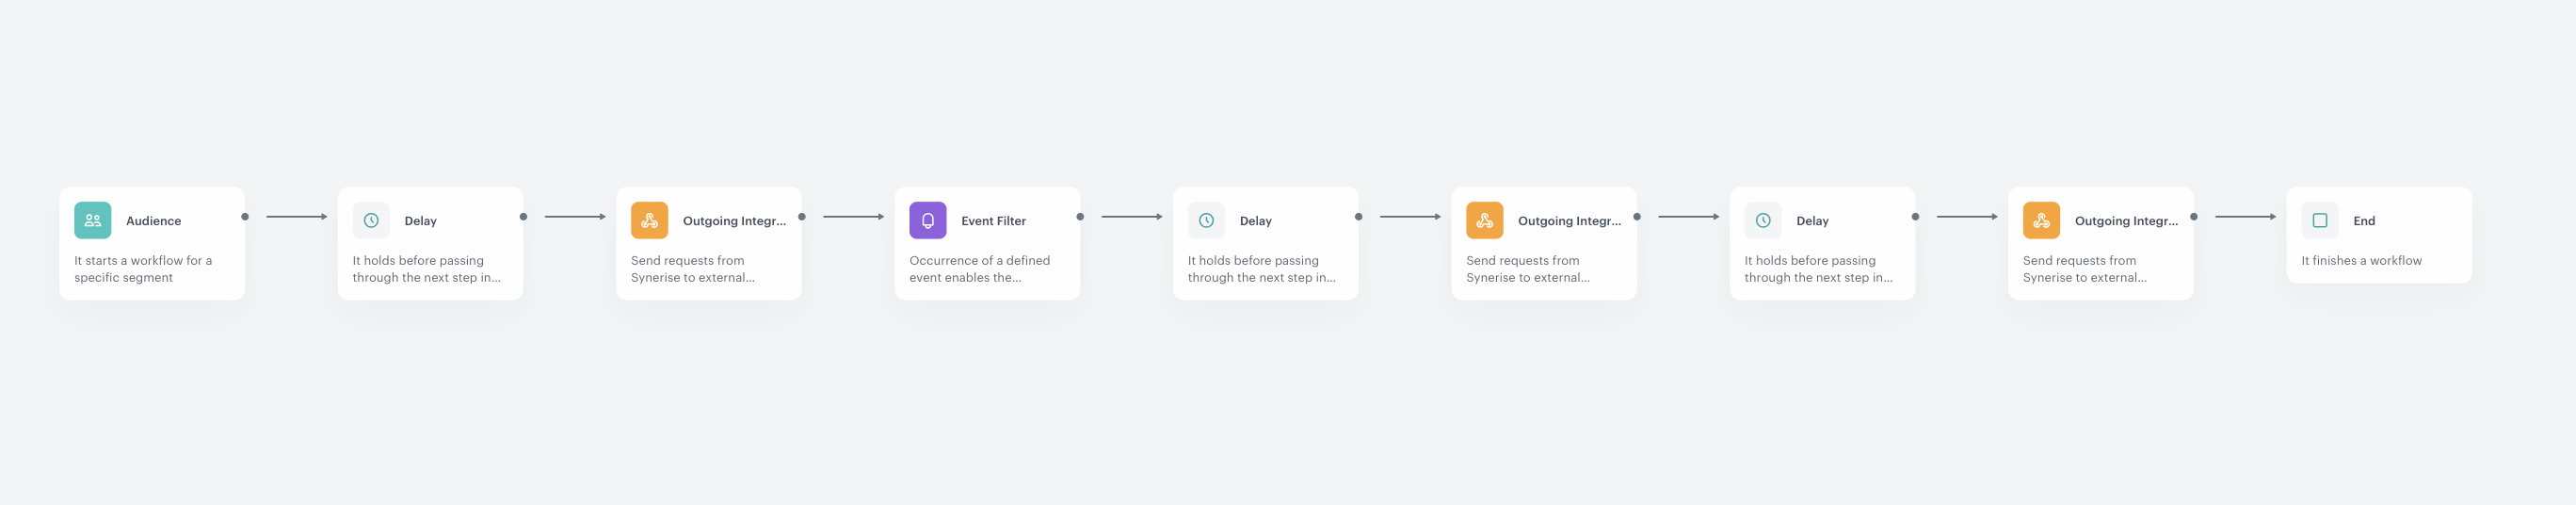
Create a workflow
In this part of the process, create a workflow which retrieves data from the report and update the report, metric and aggregate with proper SKUs. This ensures that the analyses created before remain up to date.
- Go to
 Automation > Workflows > New workflow.
 - Enter the name of the workflow.
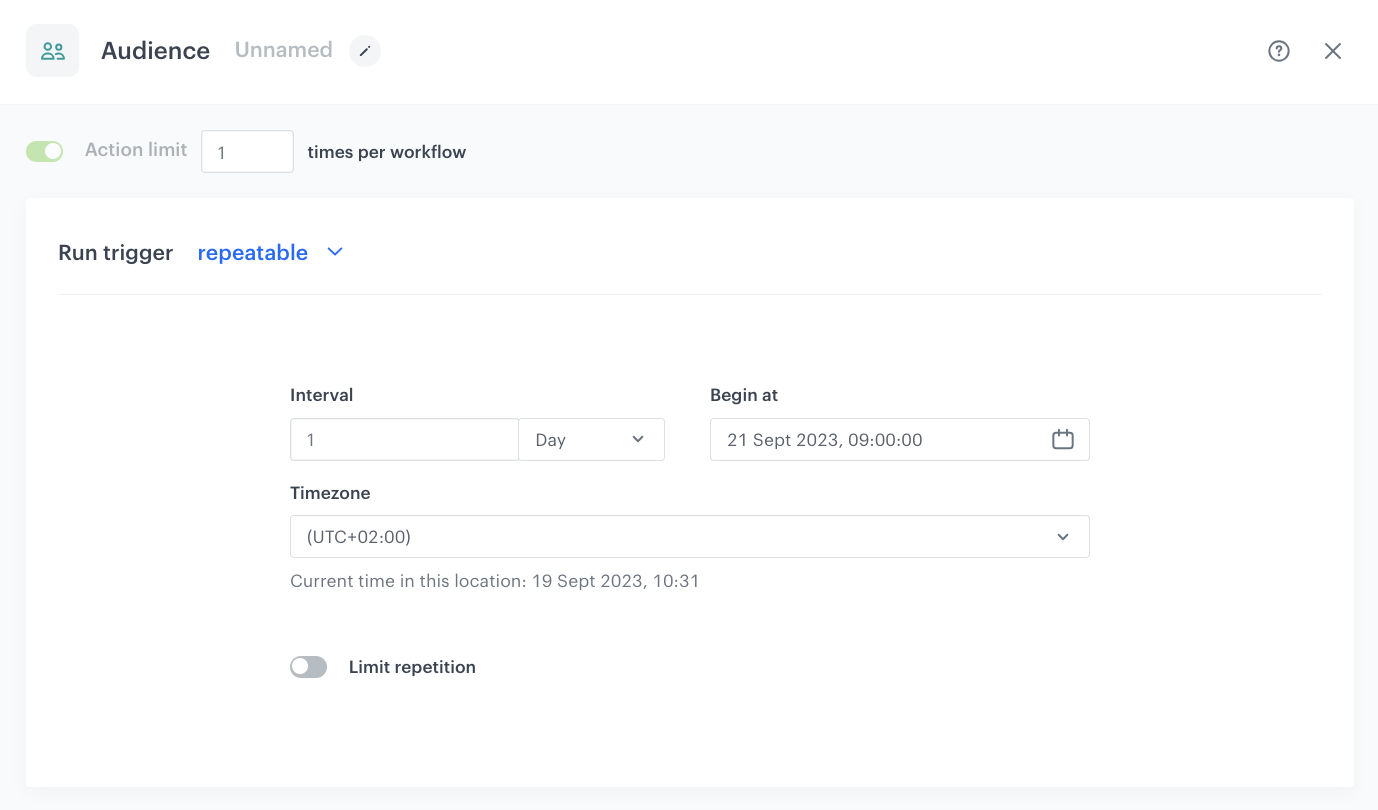
Define the Audience trigger node
Choose the Audience node as the trigger. Set the workflow as repeatable, starting everyday at 9:00 A.M. This node is necessary to facilitate repetitive launching, using the customer-related nodes (such as Event Filter) and using customer context.
- Start the workflow with the Audience node.
- In the configuration of the node, set the Run trigger option to repeatable.
- Set the interval to 1 per day.
- Choose the day and time when the process starts. Choose 9 A.M.
- As the audience of the node, you may include only yourself or a test user. The audience is not a priority.
- Click Apply.
Define the first Delay node
This node creates a 10 seconds delay before moving to the next condition of the workflow. It helps you minimize the risk that possible server errors or delays will influence your workflow.
- Add the Delay node. In the node settings:
- In the Delay field, type
10. - From the dropdown list, choose second.
- In the Delay field, type
- Click Apply.
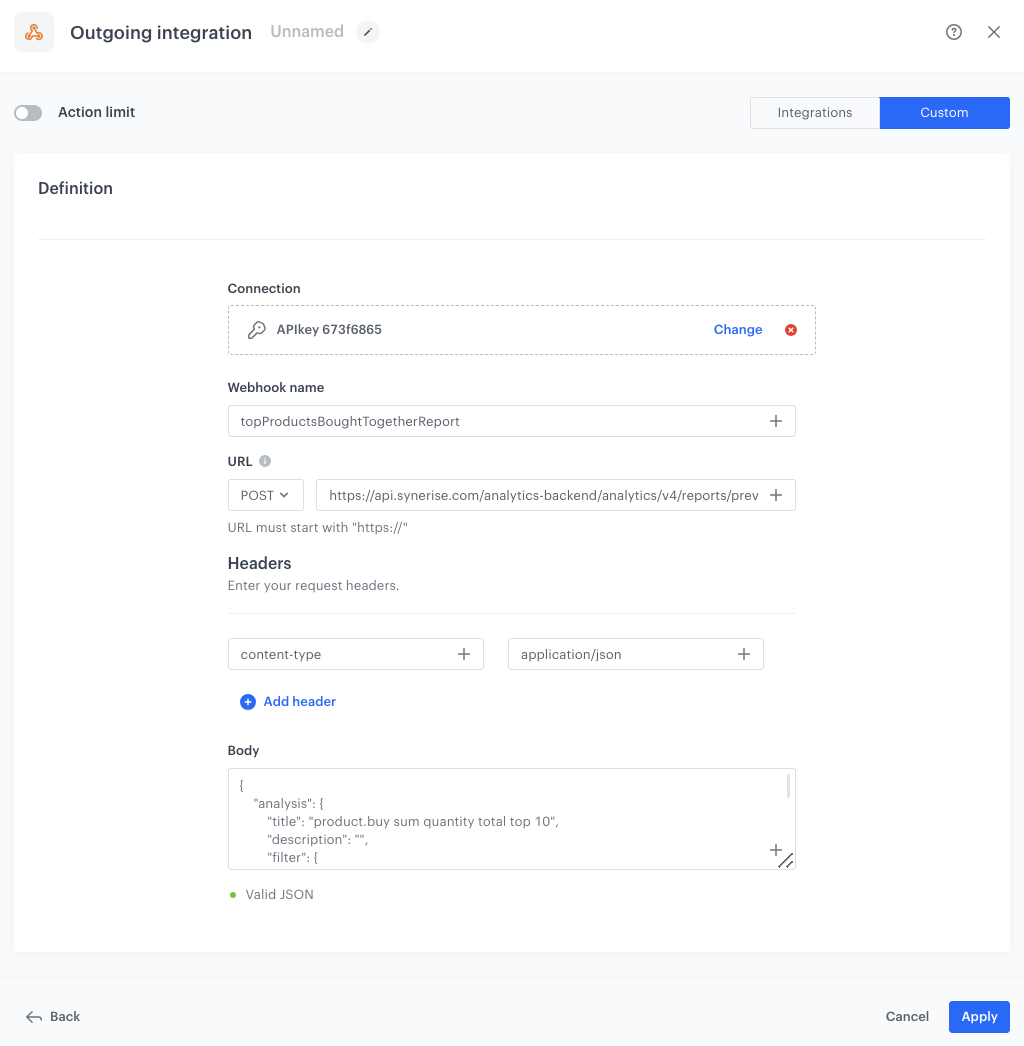
Configure the first Outgoing Integration node
This Outgoing Integration Node fetches the top 10 products from our report generated earlier. These products represent the bestsellers and will serve as the foundation for further analysis.
-
Add Outgoing integration. In the configuration of the node:
-
Choose the authentication method. In our case, it will be API key.
-
Click Add connection, and on the pop-up, enter the name of the connection and from the dropdown list, select the API Key created as a part of prerequisites.
-
Click Apply.
-
In the Webhook name field, enter the value of the
nameparameter of thewebhook.responseevent. In our case, it’stopProductsBoughtTogetherReport. -
In the URL section, select the POST method and as the endpoint URL, enter
https://api.synerise.com/analytics-backend/analytics/v4/reports/preview -
In the Headers section, as the header, add content-type and as a value, add application/json.
-
In the Body section, enter the following JSON code. As the value of the metricId, enter the ID of the metric which you can find in the URL of this metric.
{
    "analysis": {
        "title": "product.buy sum quantity total top 10",
        "description": "",
        "filter": {
            "matching": true,
            "expressions": [],
            "expression": {
                "name": "",
                "type": "EMPTY"
            }
        },
        "reportMetrics": [
            {
                "metricId": "6860f5d4-5ae2-4cc0-8472-50ddee1e4496",
                "dateFilter": {
                    "type": "RELATIVE",
                    "duration": {
                        "type": "DAYS",
                        "value": 90
                    },
                    "offset": {
                        "type": "DAYS",
                        "value": 0
                    }
                },
                "comparison": {
                    "dateFilter": {
                        "type": "ABSOLUTE"
                    }
                },
                "action": {
                    "name": "product.buy"
                },
                "format": {
                    "dataFormat": "numeric",
                    "useSeparator": true,
                    "compactNumbers": false,
                    "fixedLength": 1
                },
                "grouping": {
                    "type": "TOP",
                    "top": 10
                },
                "groups": [
                    {
                        "title": "$sku",
                        "type": "EVENT",
                        "format": {
                            "dataFormat": "numeric",
                            "useSeparator": true,
                            "compactNumbers": false,
                            "fixedLength": 1
                        },
                        "attribute": {
                            "type": "PARAM",
                            "param": "$sku"
                        }
                    }
                ],
                "eventName": "product.buy"
            }
        ]
    },
    "allowNull": true
}
-
-
Confirm the settings by clicking Apply.
-
Confirm by clicking Apply.
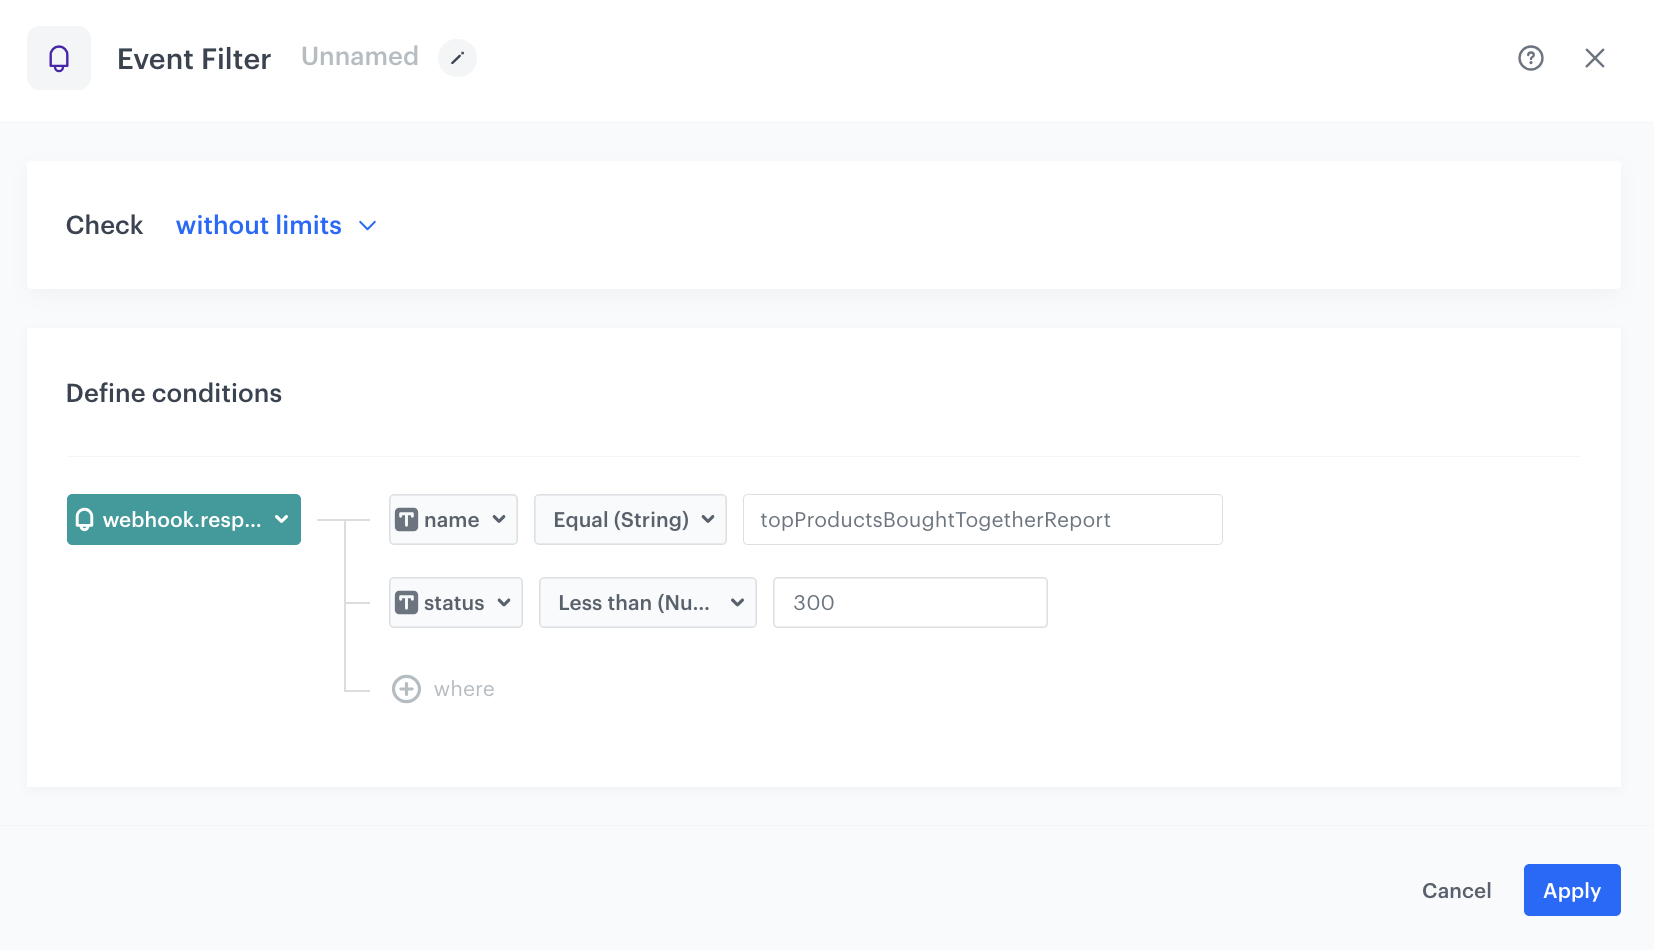
Configure the Event filter node
In this node, the workflow waits for the response from the report generation initiated in the previous step. It ensures that we proceed only when the report data is available.
- Add the Event filter node.
- Add the name for the node, in our case it has to be:
topProductsBoughtTogetherReport, because the exact name was used as the webhook name in the previous step. - Check without limits.
- From the Choose event dropdown list, select the
webhook.responseevent. - As the event parameter, select name.
- From the Choose operator dropdown list, select Equal.
- As the value, enter
topProductsBoughtTogetherReportwhich is the exact same value used as the webhook name in the previous step. - Click + where and as the event parameter, select status. The status parameter usually refers to an HTTP status code.
- From the Choose operator dropdown list, select less than (number).
- As the value, enter
300to avoid server errors. - Confirm by clicking Apply.
Define the second Delay node
This node creates a 10 second delay before moving to the next node in the workflow. It helps you minimize the risk of server errors or delays that could affect your workflow.
- Add the Delay node. In the node settings:
- In the Delay field, type
10. - From the dropdown list, choose second.
- In the Delay field, type
- Click Apply.
Configure the second Outgoing Integration node
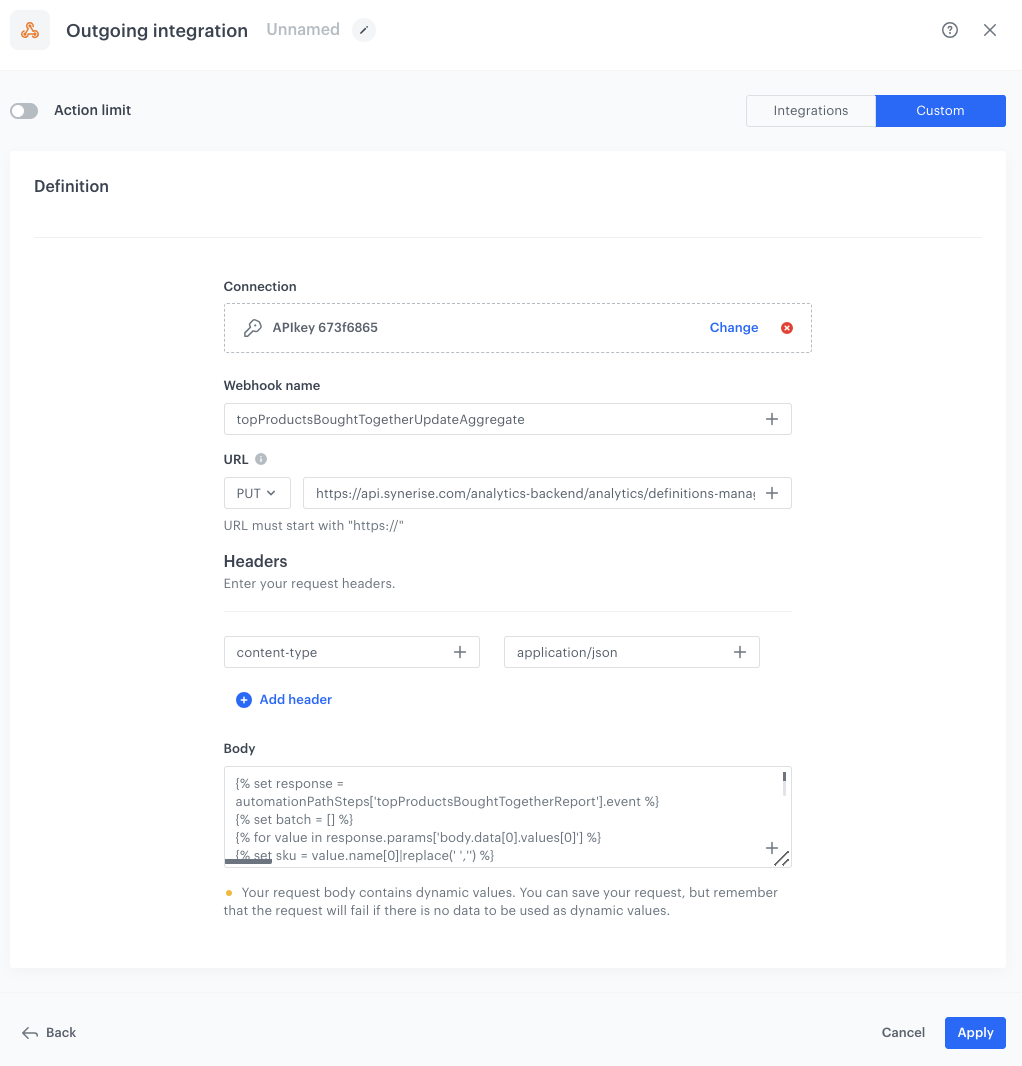
The step involves updating the aggregate you created in the previous step with additional SKUs obtained from the report generated in the first Outgoing Integration node in this workflow. This ensures that the aggregate data remains up to date. The goal of this step is to keep our aggregate data up to date, allowing us to analyze product purchases accurately.
-
Add Outgoing integration. In the configuration of the node:
-
Choose the authentication method. In our case, it will be API key.
-
Click Add connection, and on the pop-up, enter the name of the connection and from the dropdown list, select the API Key created as a part of prerequisites.
-
Click Apply.
-
In the Webhook name field, enter the value of the
nameparameter of thewebhook.responseevent. In our case, it’stopProductsBoughtTogetherUpdateAggregate. -
In the URL section, select the PUT method and as the endpoint URL, enter
https://api.synerise.com/analytics-backend/analytics/definitions-manager/aggregates/394379f0-f851-39d8-a62e-fc0613860798. Remember to replace the ID in the link with the ID of the aggregate created in the previous step. -
In the Headers section, as the header, add content-type and as a value, add application/json.
-
In the Body section add the following code snippet. As values of id and uuid, enter the ID of the aggregate which you can find in the URL of this aggregate.
{% set response = automationPathSteps['topProductsBoughtTogetherReport'].event %}
{% set batch = [] %}
{% for value in response.params['body.data[0].values[0]' %}
{% set sku = value.name[0]|replace(' ','') %}
    {% do batch.append(sku) %}
{% endfor %}

{
  "aggregate": {
    "type": "LAST_MULTI",
    "size": 100,
    "name": "product.buy last 100 sku in arrayOfSKUs",
    "description": "",
    "unique": true,
    "eventName": "product.buy",
    "action": {
      "name": ""
    },
    "dateFilter": {
      "type": "ABSOLUTE"
    },
    "expressions": [
      {
        "constraint": {
          "type": "STRING_ARRAY",
          "logic": "IN",
          "value": {
            "type": "CONSTANT",
            "constant": {{ batch|tojson }}
          }
        },
        "attribute": {
          "type": "PARAM",
          "param": "$sku"
        }
      }
    ],
    "attribute": {
      "type": "PARAM",
      "param": "$orderId"
    },
    "uuid": "394379f0-f851-39d8-a62e-fc0613860798"
  },
  "isVisibleForClientProfile": false
}
-
-
Confirm the settings by clicking Apply.
-
Confirm by clicking Apply.
Define the third Delay node
This node creates a 10 second delay before moving to the next condition of the workflow. It helps you minimize the risk of server errors or delays that could affect your workflow.
- Add the Delay node. In the node settings:
- In the Delay field, type
10. - From the dropdown list, choose second.
- In the Delay field, type
- Click Apply.
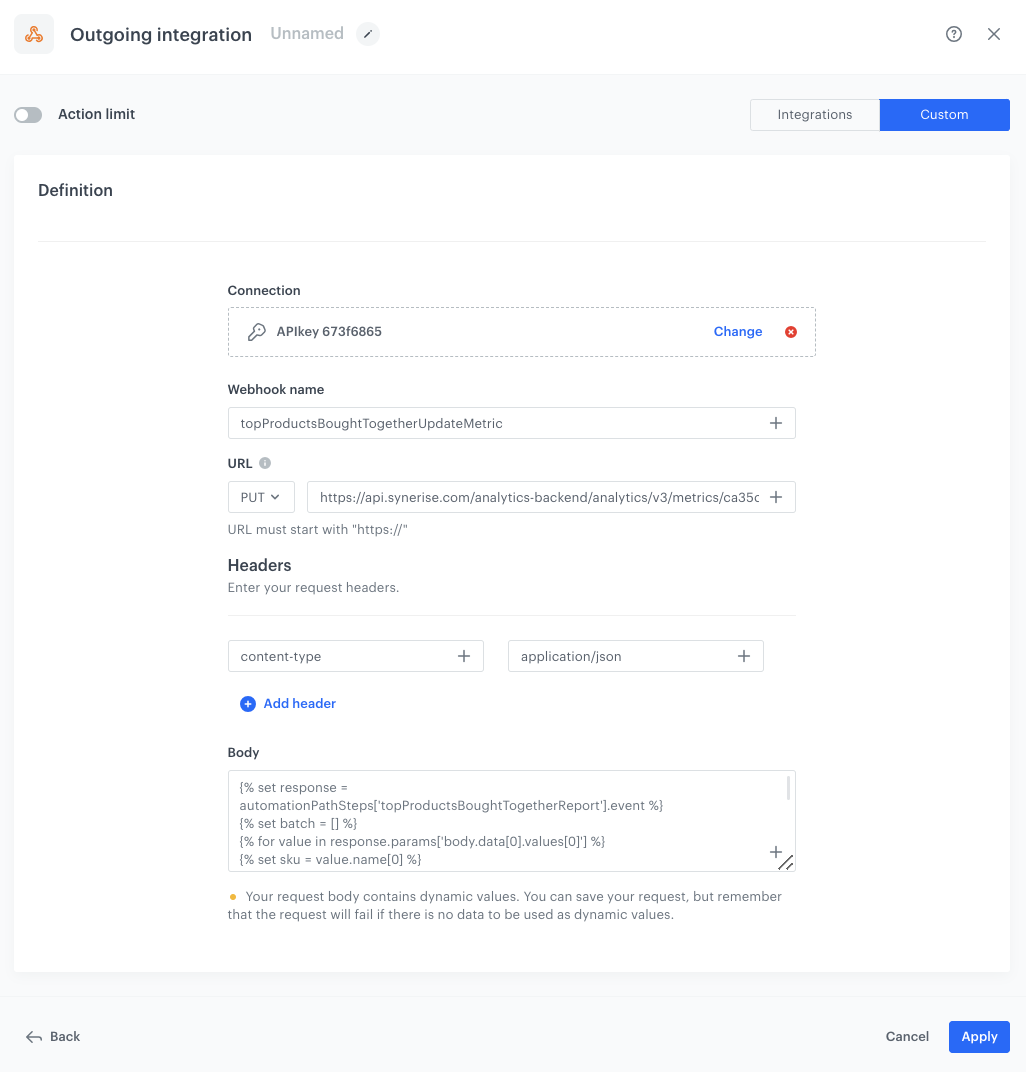
Configure the third Outgoing Integration node
The next step involves updating the metric with SKUs obtained from the report generated in the first Outgoing integration node in this workflow. This ensures that the metric data remains up to date.
-
Add Outgoing integration. In the configuration of the node:
-
Choose the authentication method. In our case, it will be API key.
-
Click Add connection, and on the pop-up, enter the name of the connection and from the dropdown list, select the API Key created as a part of prerequisites.
-
Click Apply.
-
In the Webhook name field, enter the value of the
nameparameter of thewebhook.responseevent. In our case, it’stopProductsBoughtTogetherUpdateMetric. -
In the URL section, select the PUT method and as the endpoint URL, enter
https://api.synerise.com/analytics-backend/analytics/v3/metrics/ca35c24c-de50-4f7b-8e1d-38adaa819036. Remember to replace the ID in the link with the ID of the metric created in the previous step. -
In the Headers section, as the header, add content-type and as a value, add application/json.
-
In the Body section add the following JSON frame with Jinjava code. In the place id and uuid enter the aggregate ID which is located in the link to this aggregate.
{% set response = automationPathSteps['topProductsBoughtTogetherReport'].event %}
{% set batch = [] %}
{% for value in response.params['body.data[0].values[0]'] %}
{% set sku = value.name[0] %}
    {% do batch.append(sku) %}
{% endfor %}

{
    "analysis": {
        "title": "Products bought together with top 10",
        "description": "",
        "format": {
            "dataFormat": "numeric",
            "useSeparator": true,
            "compactNumbers": false,
            "fixedLength": 1
        },
        "comparison": {
            "dateFilter": {
                "type": "ABSOLUTE"
            }
        },
        "metricType": "SIMPLE",
        "expression": {
            "type": "FUNCTION",
            "function": "BRACKET",
            "arg": {
                "type": "VALUE",
                "value": {
                    "title": "unnamed",
                    "type": "EVENT",
                    "occurrenceType": "ALL",
                    "aggregation": {
                        "type": "SUM",
                        "attribute": {
                            "type": "PARAM",
                            "param": "$quantity"
                        }
                    },
                    "dateFilter": {
                        "type": "ABSOLUTE"
                    },
                    "action": {
                        "name": "product.buy"
                    },
                    "filter": {
                        "matching": true,
                        "expressions": [],
                        "expression": {
                            "name": "",
                            "type": "EMPTY"
                        }
                    },
                    "expressions": [
                        {
                            "constraint": {
                                "type": "STRING_ARRAY",
                                "logic": "IN",
                                "value": {
                                    "type": "CLIENT",
                                    "attribute": {
                                        "type": "AGGREGATE",
                                        "id": "394379f0-f851-39d8-a62e-fc0613860798",
                                        "uuid": "394379f0-f851-39d8-a62e-fc0613860798"
                                    }
                                }
                            },
                            "attribute": {
                                "type": "PARAM",
                                "param": "$orderId"
                            }
                        },
                        {
                            "constraint": {
                                "type": "STRING_ARRAY",
                                "logic": "NOT_IN",
                                "value": {
                                    "type": "CONSTANT",
                                    "constant": {{ batch|tojson }}
                                }
                            },
                            "attribute": {
                                "type": "PARAM",
                                "param": "$sku"
                            }
                        }
                    ],
                    "eventName": "product.buy"
                },
                "title": "unnamed"
            }
        },
        "isVisibleForClientProfile": false
    },
    "allowNull": true
}
-
-
Confirm the settings by clicking Apply.
-
Confirm by clicking Apply.
Prepare the final settings
- Add the End node.
- Optionally, add titles to each node so the workflow will be more understandable to your colleagues.
- Enter the name of the workflow.
- To save it as a draft, click Save, or activate the workflow by clicking Save & Run.
Create a dashboard
In this part of the process, to conveniently preview the results of all reports you created in the previous part of the process, create a dashboard. This dashboard serves as a central hub for accessing key insights into your product performance.
-
Go to
Analytics > Dashboard > New dashboard. -
Enter a meaningful name of the dashboard.
-
Add both reports you created earlier in the process:
- Report with top 10 bestsellers,
- Dynamic report.
Tip: You can learn more about creating dashboards here.
-
Save the dashboard.
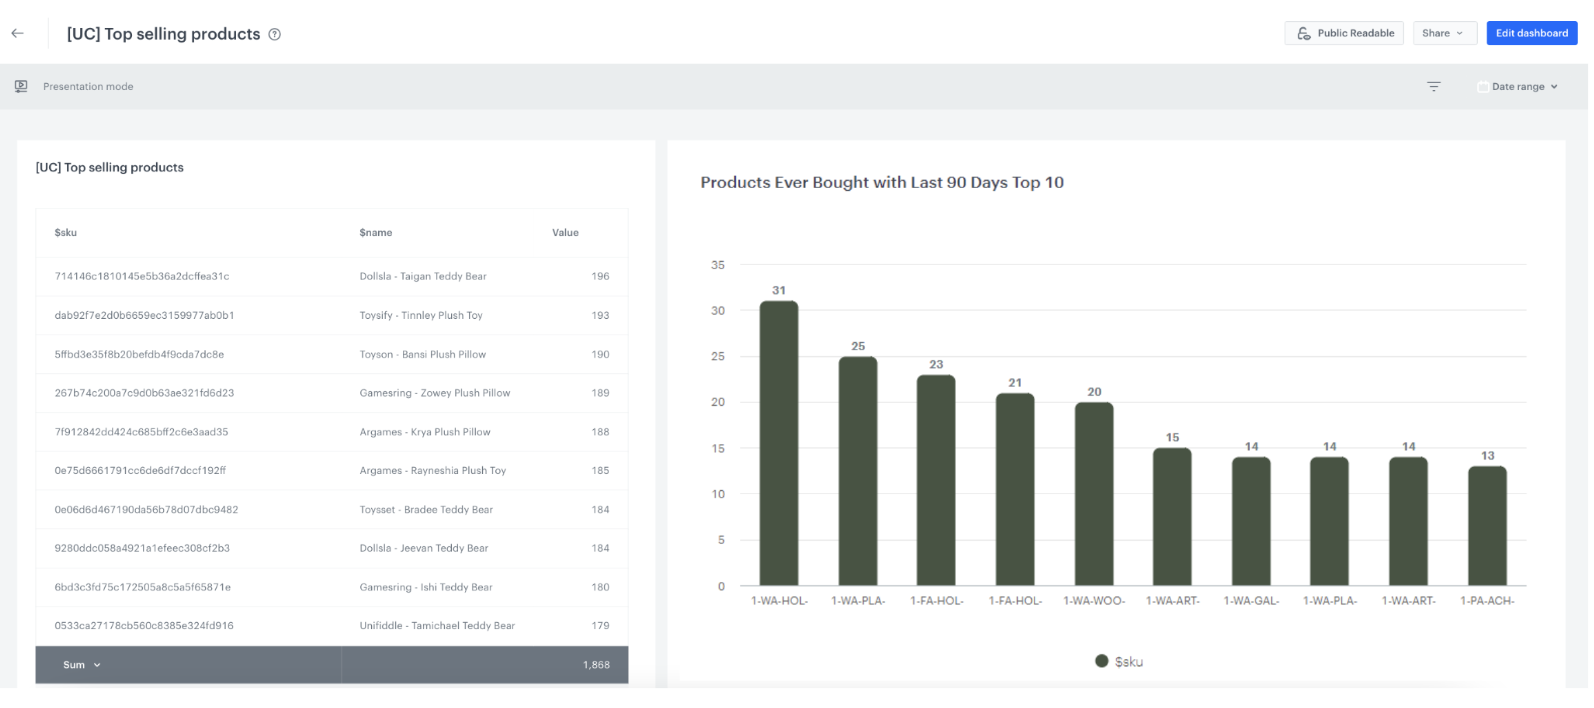
Dashboard with both reports
Check the use case set up on the Synerise Demo workspace
You can check the configuration of all elements used in the use case, directly in Synerise Demo workspace:
- aggregate
- metric with top selling products
- metric with the sum of quantity of products in the specific order
- report with top selling products
- dynamic report
- automation
- dashboard
If you don’t have access to the Synerise Demo workspace, please leave your contact details in this form, and our representative will contact you shortly.