

Propensity-based customer segmentation
This use case is a short continuation of the Propensity - brand use case and it describes the process of creating a segmentation based on the score of the propensity prediction. The result of the segmentation shows the assignment of customers to the likelihood of purchase of particular products.
Prerequisites
- Add a tracking code to your website.
- Create a Propensity prediction that produces the 5-point score (very low, low, medium, high, and very high).
- Make a note of the
modelIdparameter (available in the parameters of thesnr.propensity.scoreevent).
Click to see where to find modelId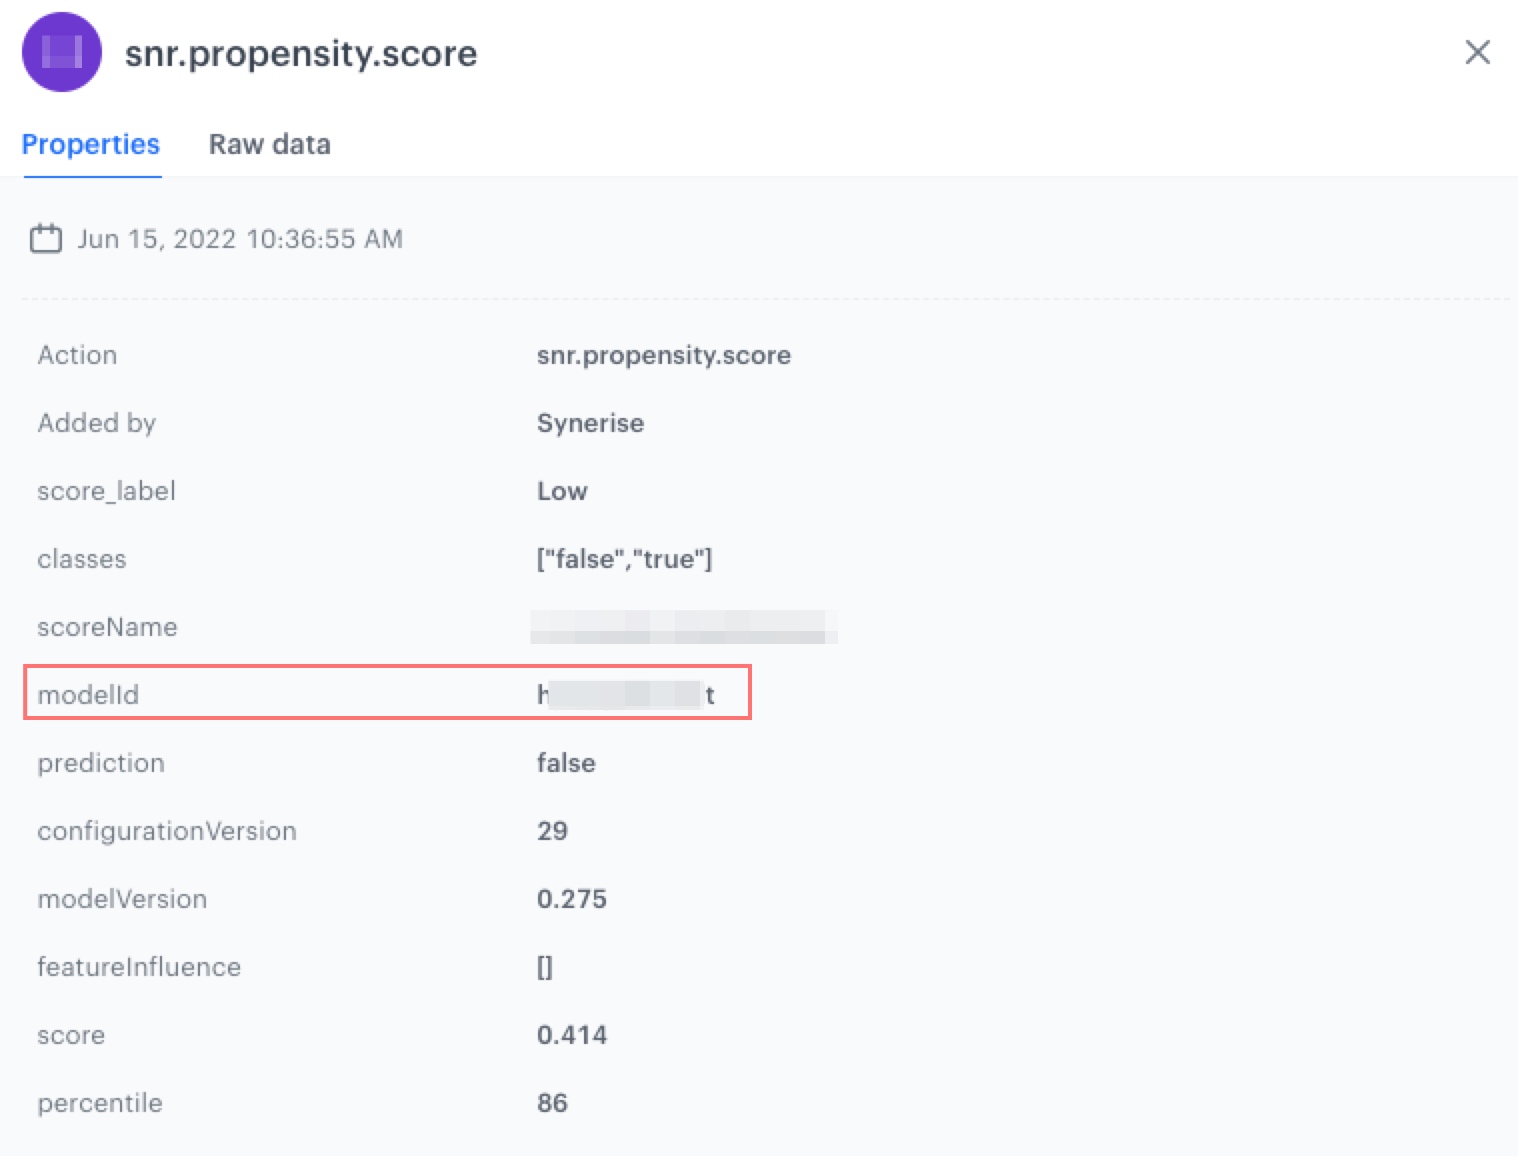
Conditions of the segmentation
Process
In this use case, you will go through the following steps:
Create an aggregate
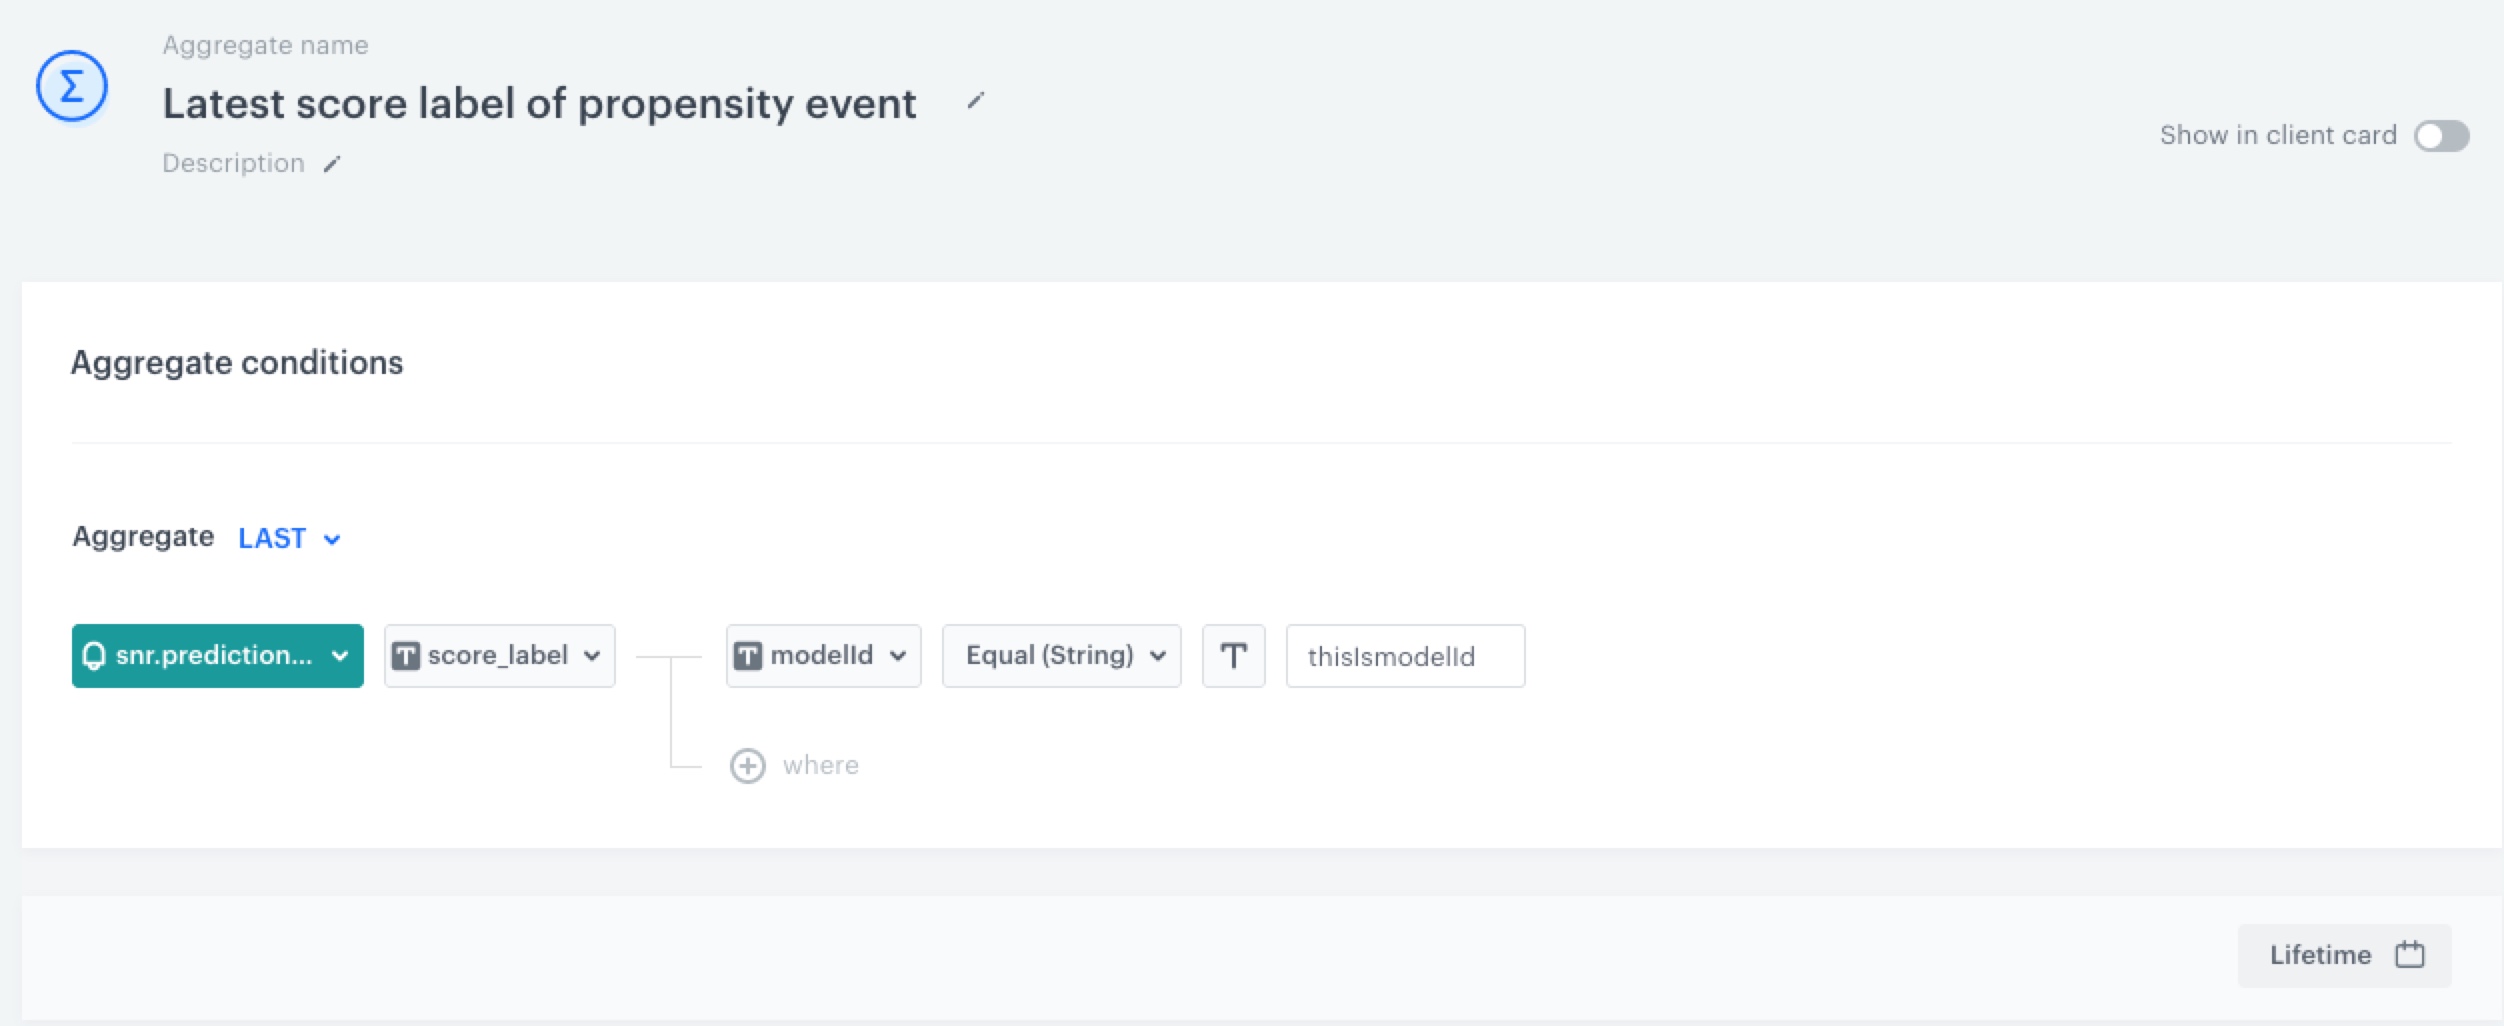
As the first part of the process, create an aggregate that returns the latest score of the propensity prediction of a specific model.
- Go to Analytics > Aggregates > New aggregate.
- Enter a meaningful name of the aggregate.
- As the aggregate type, select Last.
- Select the snr.propensity.score event.
- As the event parameter, select score_label.
- Click + where.
- From the Choose parameter dropdown list, select modelId.
- As the logical operator, select Equal.
- In the text field, enter the value of the modelId parameter.
- As the date range, select Lifetime.
- Save the aggregate.
Create segmentation
- Go to Analytics > Segmentations > New segmentation.
- Enter the name of the segmentation.
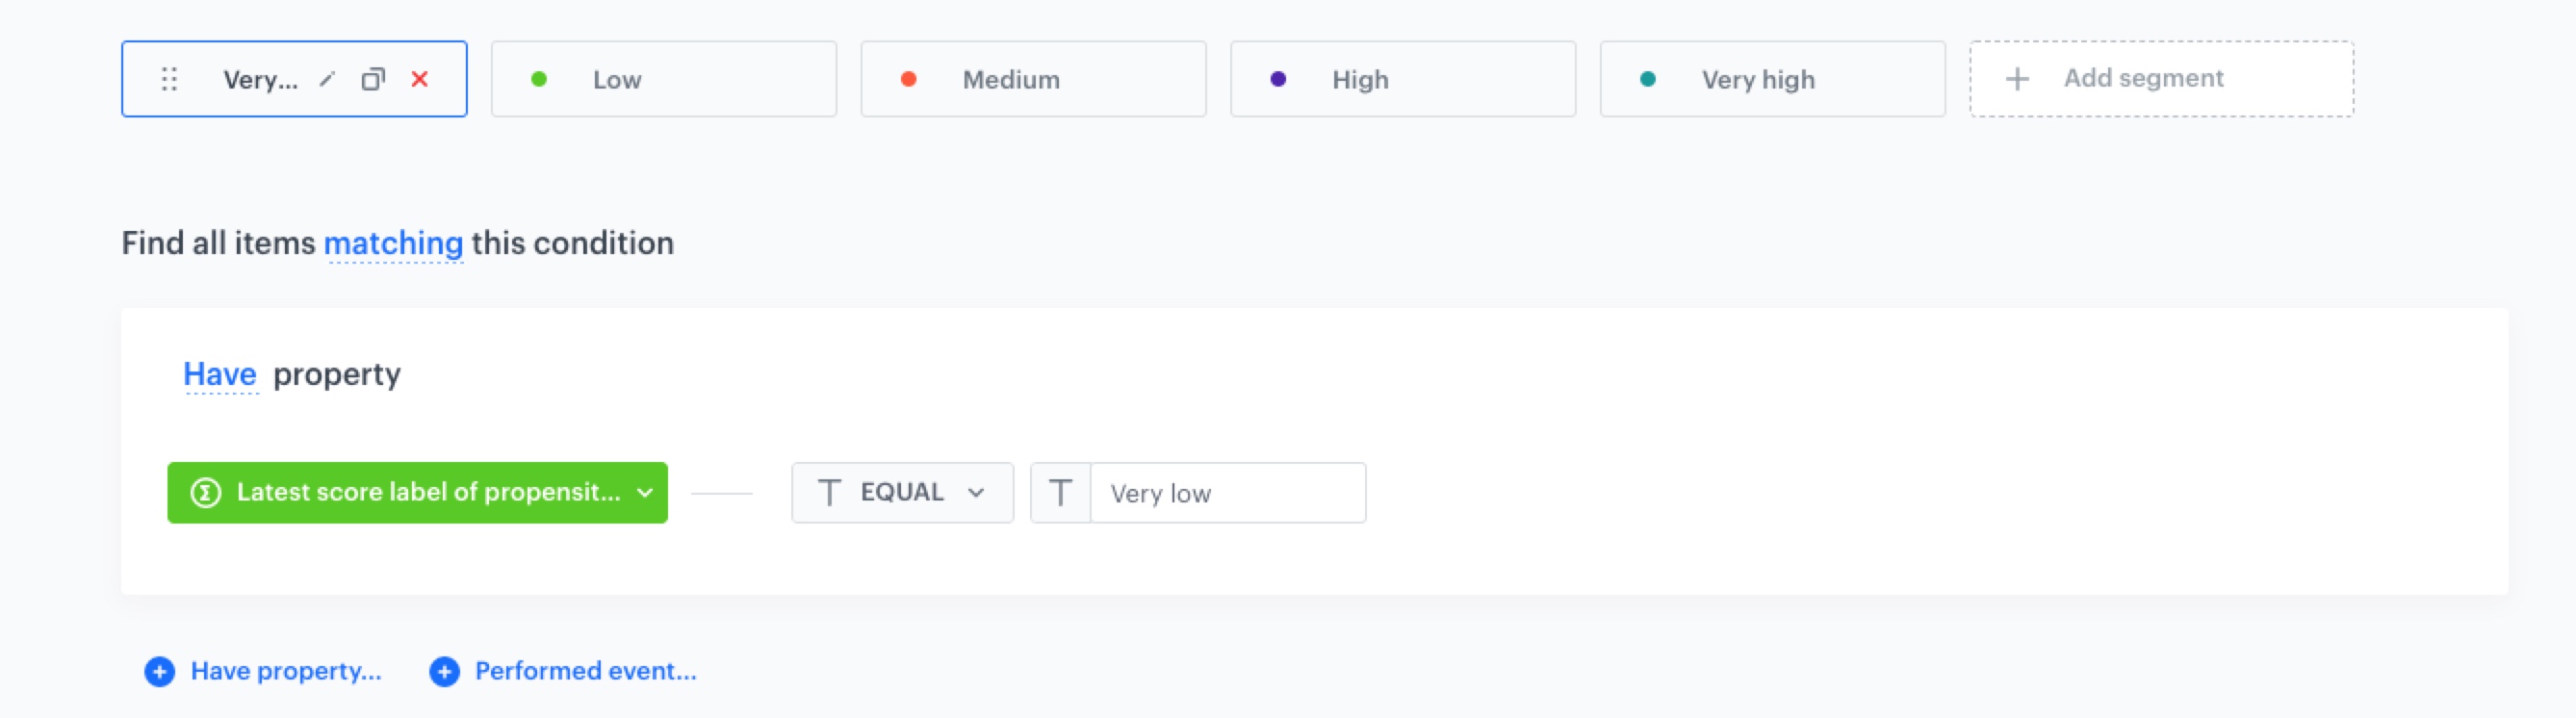
- By clicking Add segment add five segments and name each of them as follows:
Very low,Low,Medium,High,Very high.Very low- Click Have property….
- Select the aggregate you created in the previous step.
- As the logical operator, select EQUAL.
- In the text field, enter
Very low
Low- Click Have property….
- Select the aggregate you created in the previous step.
- As the logical operator, select EQUAL.
- In the text field, enter
Low
Medium- Click Have property….
- Select the aggregate you created in the previous step.
- As the logical operator, select EQUAL.
- In the text field, enter
Medium
High- Click Have property….
- Select the aggregate you created in the previous step.
- As the logical operator, select EQUAL.
- In the text field, enter
High
Very high- Click Have property….
- Select the aggregate you created in the previous step.
- As the logical operator, select EQUAL.
- In the text field, enter
Very high
Preview segmentation
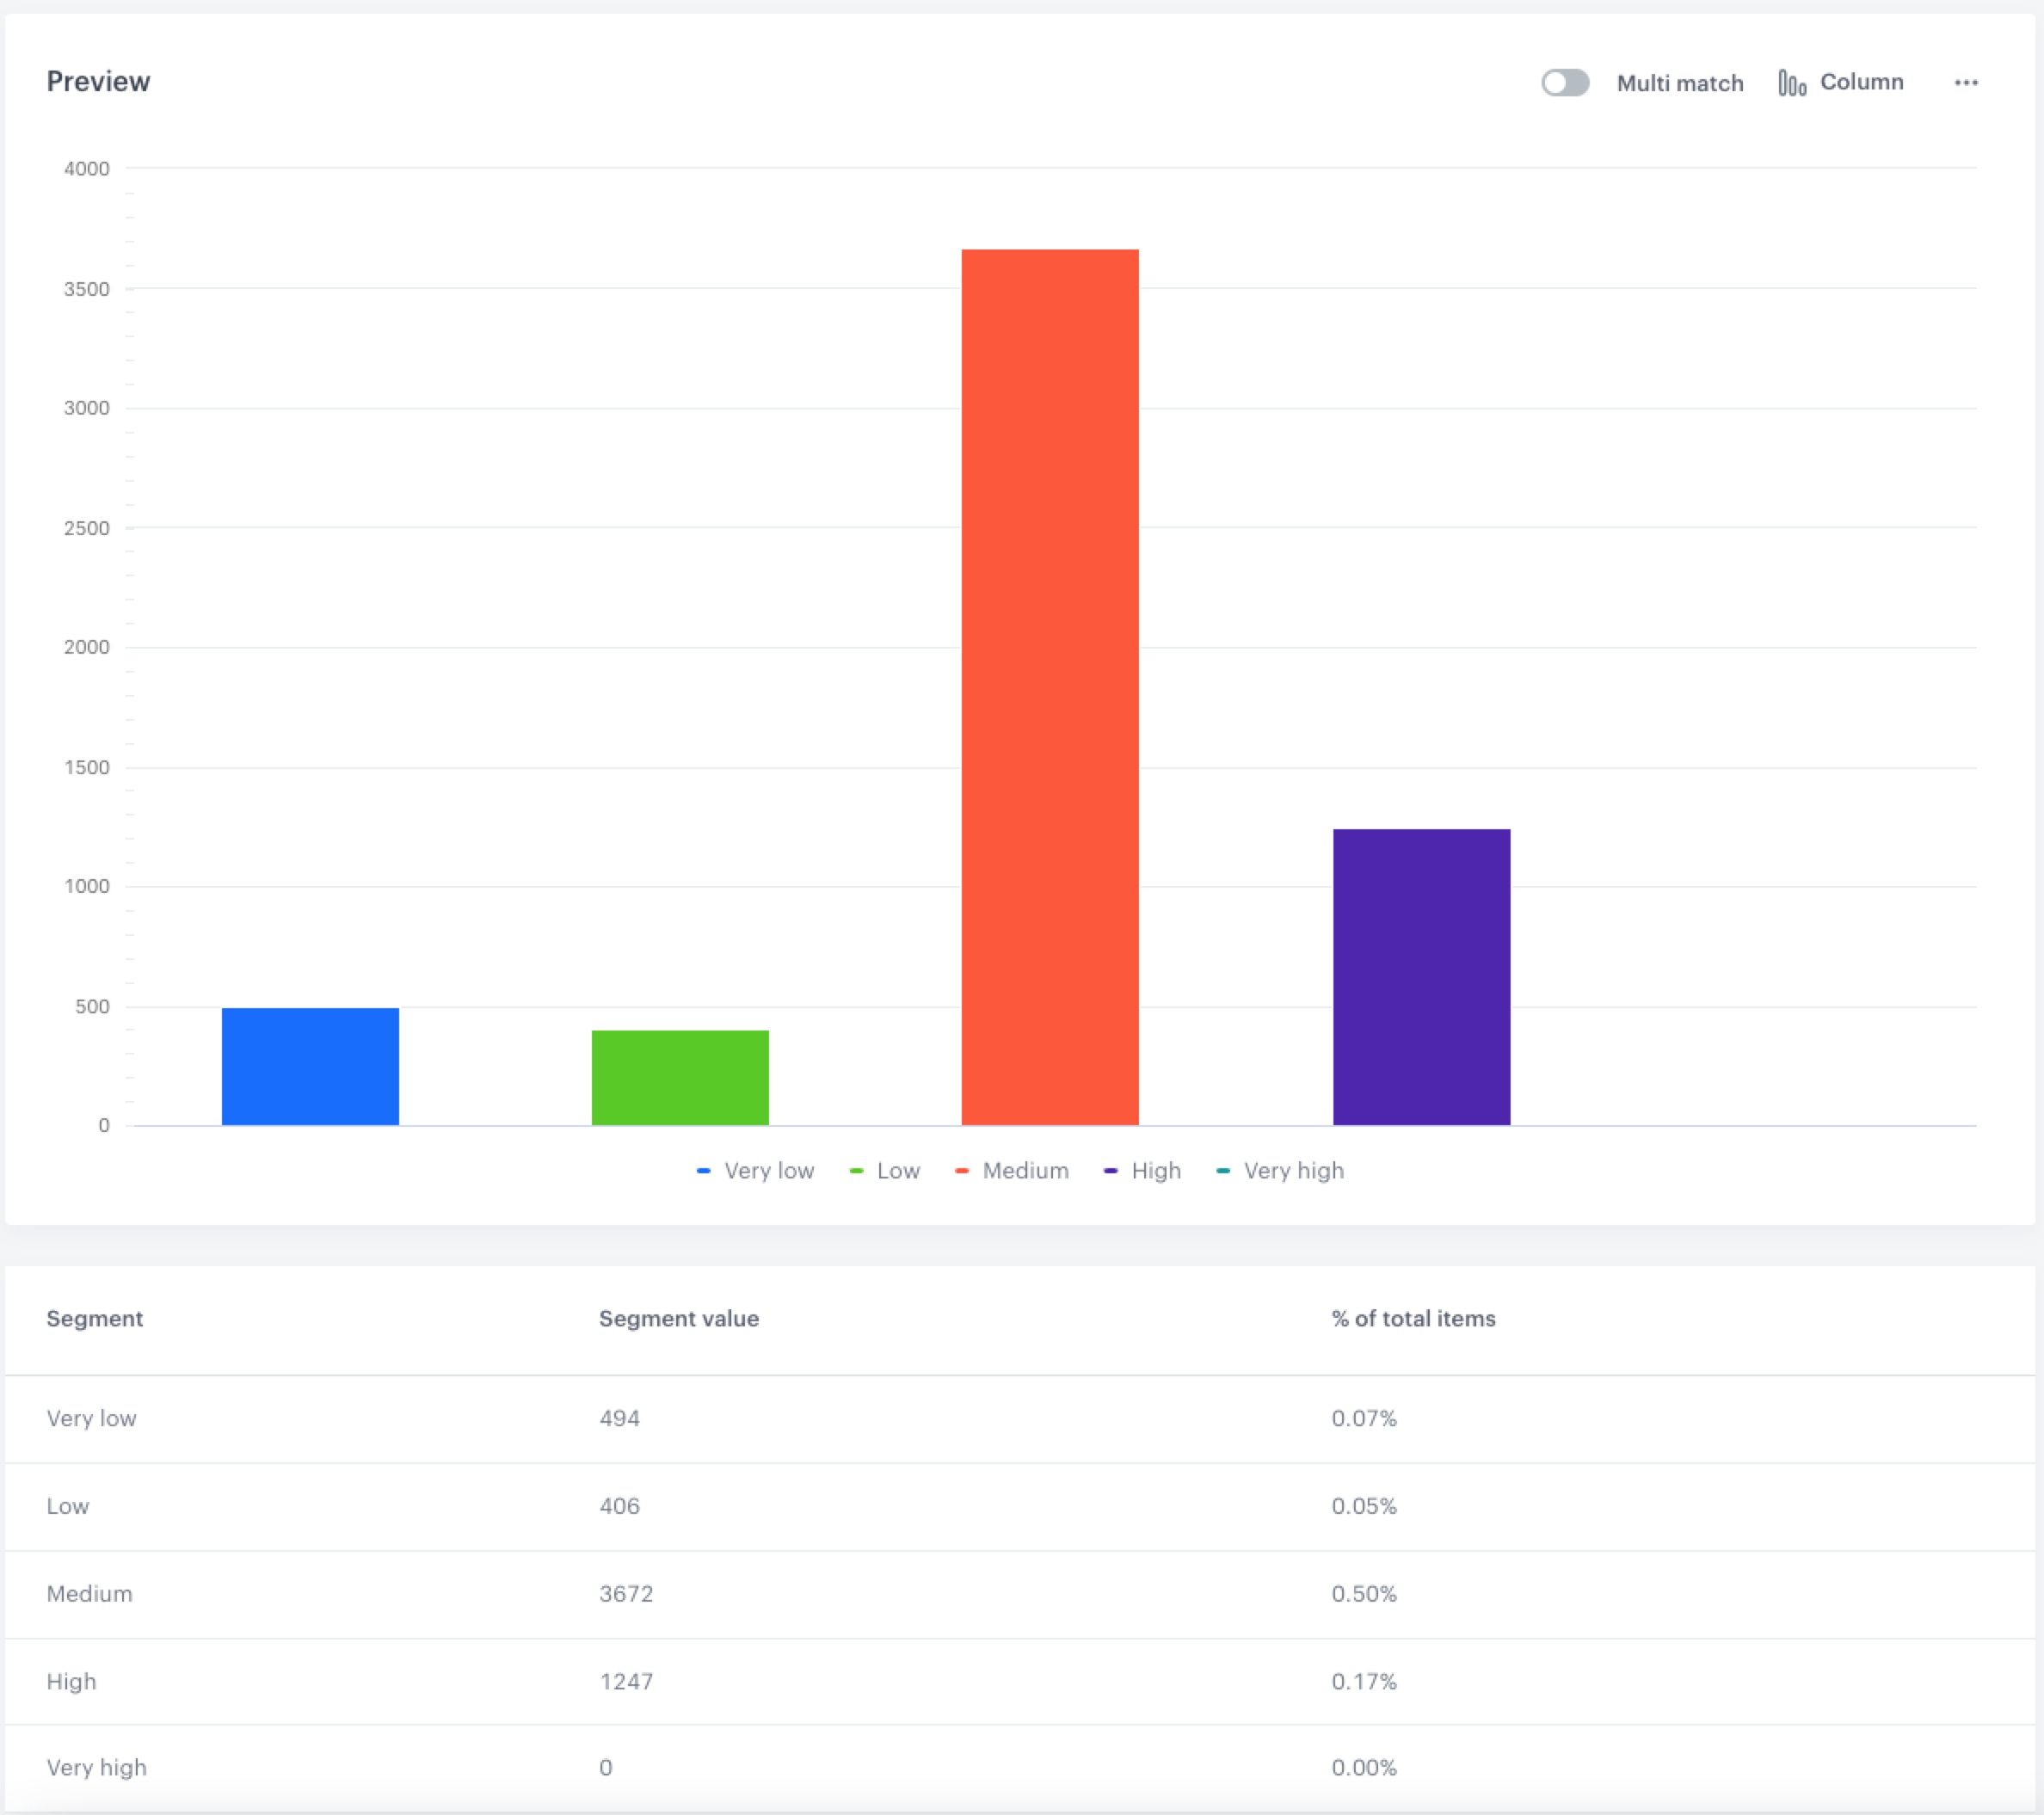
- Click Show preview.
You receive the number of customers in each segment and the percentage of each segment in relation to the whole population in the segmentation. - Additionally you can change the chart type - pie chart and column chart. You can also export the information to CSV/XLSX (data) or JPEG/PNG/PDF (chart).
Check the use case set up on the Synerise Demo workspace
You can check the configuration of every element of this process directly in Synerise Demo workspace:
If you don’t have access to the Synerise Demo workspace, please leave your contact details in this form, and our representative will contact you shortly.