Find customers who are most likely to return items
Each store can identify customers who return or exchange products more often than others. In this case, we are dealing with “serial returners” - shoppers responsible for excessive returns. Some of them may have insincere intentions, while the others may suffer from controlling their buying behavior. Typically, these customers cost sellers a lot of money, so it’s helpful to know which customers are likely to return and to plan the steps to prevent frequent returns and save the company time and money.
This use case describes the process of creating a segmentation of customers with the highest propensity for returns. This segmentation can later be excluded from selected campaigns that provide promotional codes or other discounts, helping a company optimize the cost of planned campaigns that are oriented toward customers who will benefit from such a promotion and enjoy the purchase.
Prerequisites
-
Integrate JS SDK or implement Synerise SDK in your mobile application - greater data collection will allow the model to be better trained and produce better results.
-
Implement a custom event that refers to the returned products. As an example, such an event could be named
product.return. The exemplary event is available below:SR.event.trackCustomEvent { "label": "The customer returned product", "client": { "email": "testDoc@synerise.com" }, "action": "product.return", "params": { "product_sku": "xxx", "orderId": "xxx", "reason_of_return": "shoes were too small" } }
Process
- Create a target segmentation.
- Create a source segmentation.
- Create a prediction.
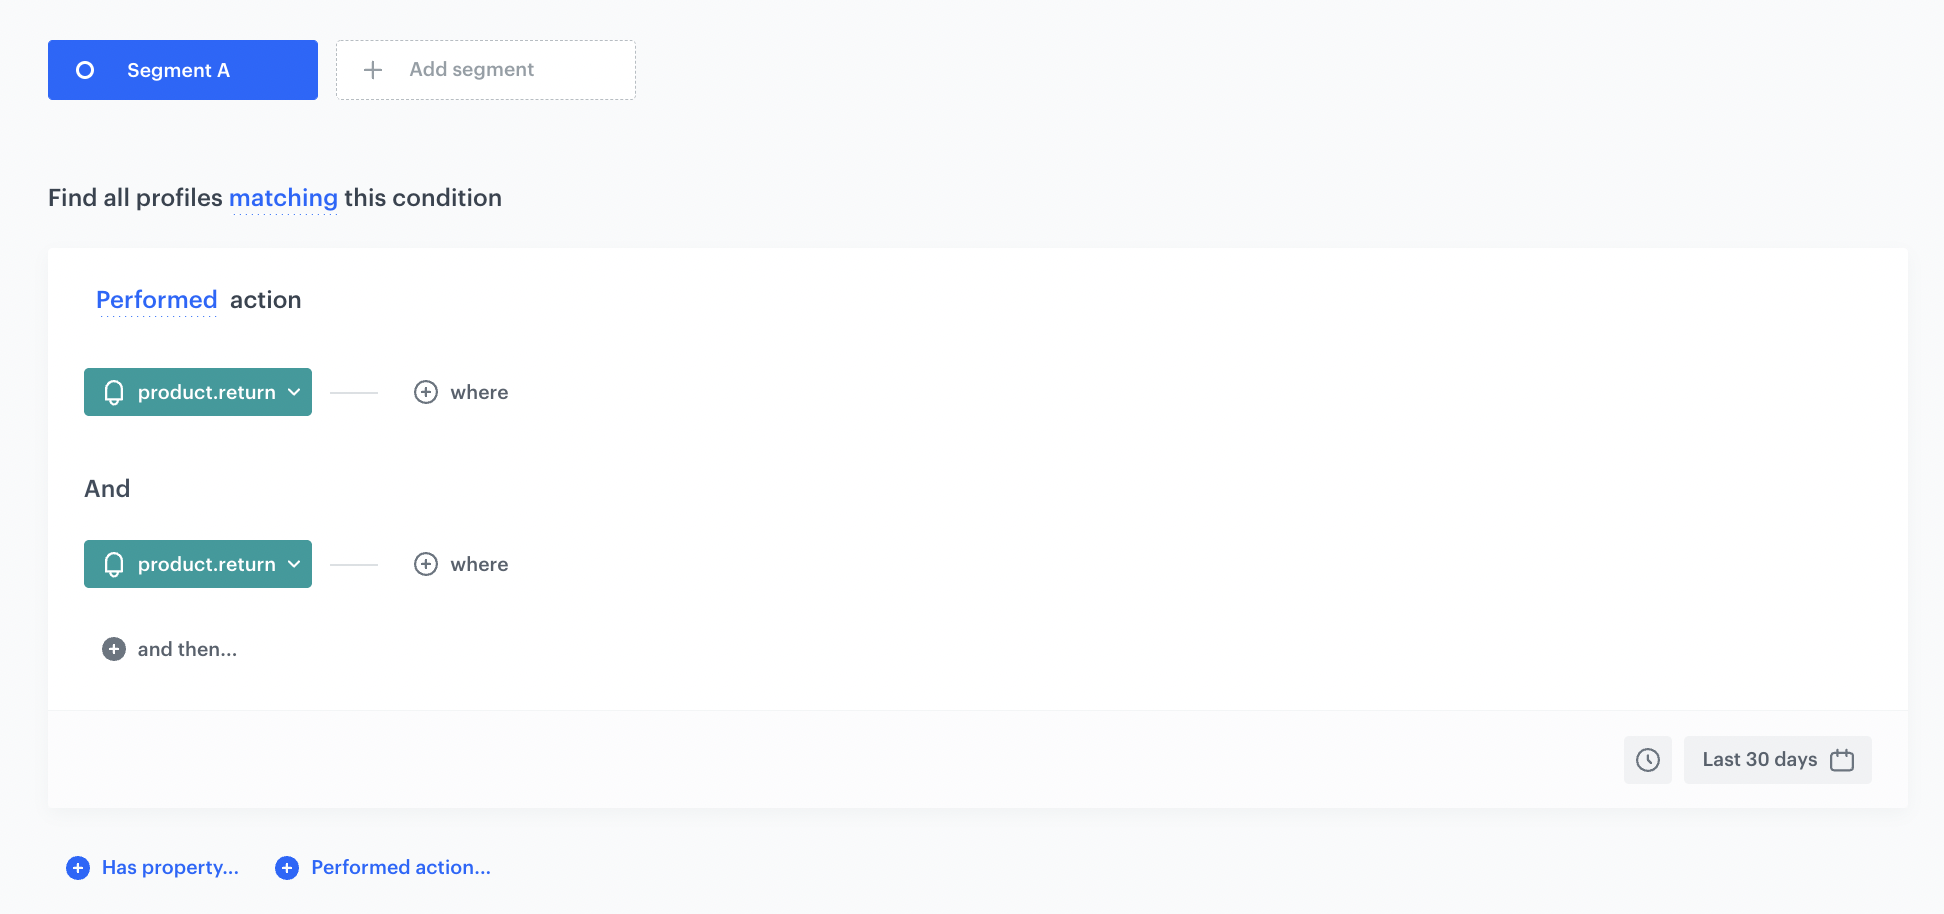
Create a source segmentation
In this part of the process, create a source segmentation that contains customers who will be compared with the customers in the target segmentation. This segmentation includes customers who have made at least two returns in the last 30 days. The fastest way to make such a segmentation is to create a product.return event funnel.
-
Go to
 Analytics > Segmentations > New segmentation.
 -
Enter the name of the segmentation.
-
From the Performed actions dropdown list, select the
product.returnevent. -
From the and then dropdown list, select the same event.
-
As the time range, set Last 30 days.
Note: You can freely manage the number of events in the funnel and the selected time range to create conditions that suit your business objectives. -
Save the segmentation.
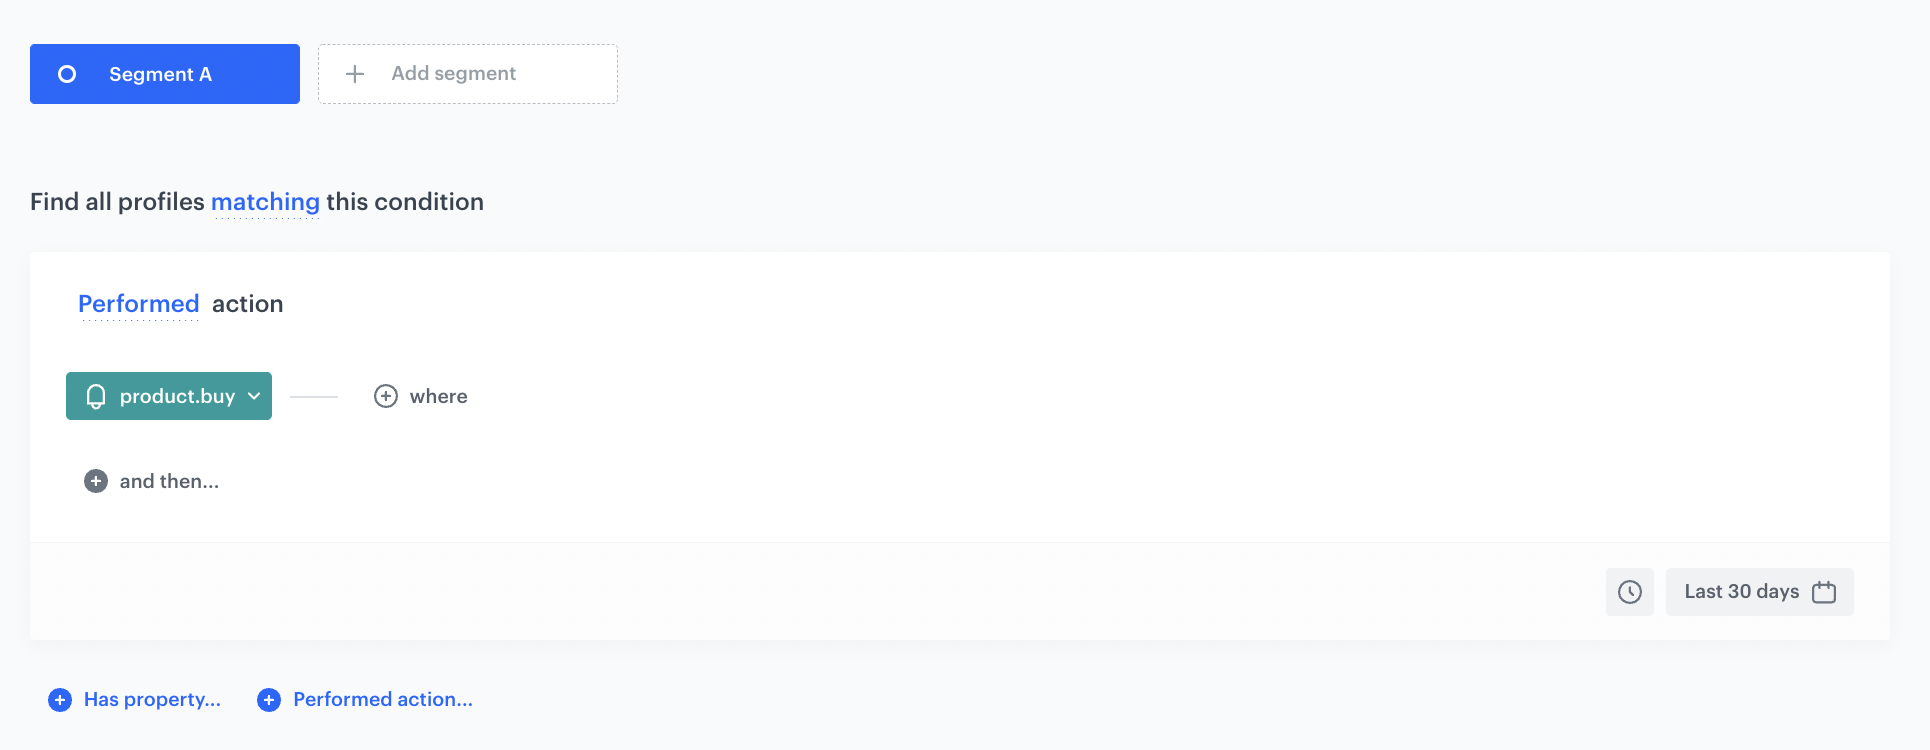
Create a target segmentation
Create a segment of customers among whom you want to find those most likely to make a return.
- Go to Analytics > Segmentations > New segmentation.
- Enter the name of the segmentation.
- From the Performed actions dropdown list, select the
product.buyevent. - As the time range, set Last 30 days.
- Save the segmentation.
Create a prediction
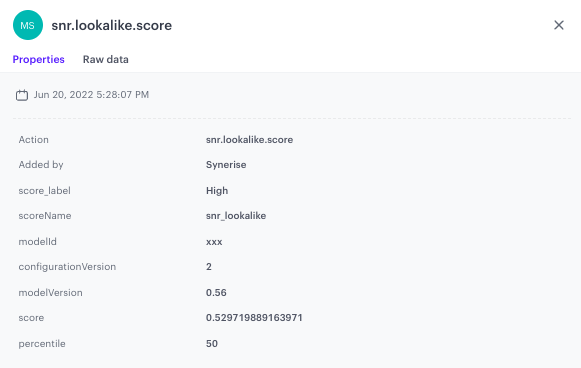
In this part of the process, create a Lookalikes prediction which compares the two segmentations - the engine looks for customers in the target segmentation who are most similar to the customers in the source segmentation. On the profile cards of all customers from the target segmentation, a snr.lookalike.score event is generated. In the details of the event, you can find the score_label parameter that describes the similarity of a customer to the customers in the source segmentation. The score_label parameter for this particular prediction takes two values: low or high.
-
Go to
 > New prediction.
 -
In the Select prediction type window that appears, click Lookalikes.
-
Click Apply.
-
In the Audience section, click Define.
-
In the Source segmentation subsection, click Choose segmentation.
-
From the dropdown list, select the source segmentation you created before.
-
In the Target segmentation subsection, click Choose segmentation.
-
From the dropdown list, select the target segmentation you created before.
-
Confirm by clicking Apply.
-
In the Settings section, click Change.
-
Enable the Set up recurring prediction calculation option.
-
Set the recalculation of the prediction every 30 days. The segmentation is recalculated before a prediction is recalculated - recalculation of the segmentation concerns recurring predictions which intervals are longer than several hours.
Note: You can define a different recalculation time that better fits your business goals. -
Select the 2-point scale.
-
Confirm by clicking Apply.
-
Click Save & Calculate.
What’s next
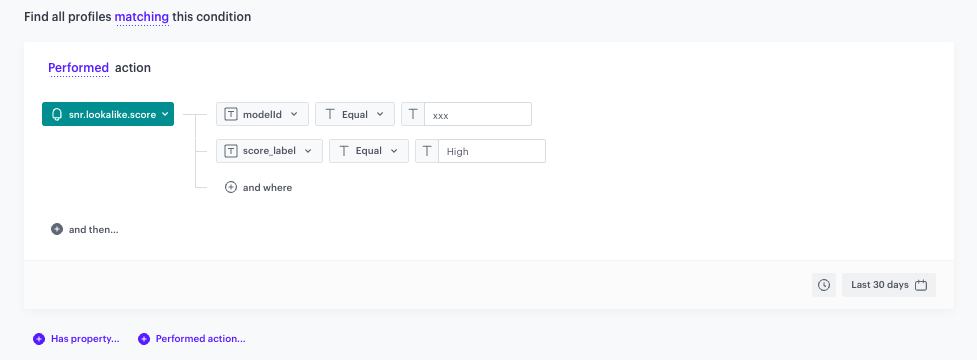
Based on the snr.lookalike.score event, create a segmentation for cusomers with the highest lookalike score (customers who are most likely to return). To define the size of the recipient group, you can use the score_label parameter of the snr.lookalike.score with the score value set to High. Below you can find an example of the snr.lookalike.score event that appears in the customer profile.
An example of the segmentation of customers with the highest probability to return is shown in the following screen:
Later, you can use this segmentation to exclude it for example from email or SMS promotional campaigns, saving campaign costs on customers who are likely to return products purchased within these campaigns.
Check the use case set up on the Synerise Demo workspace
You can check the configuration of each step from this use case in our Synerise Demo workspace.
You can find the following segmentations:
Also you can find the prediction in our Synerise Demo workspace. Go to the Predictions tab, on the left menu select Lookalikes, and then paste the URL of this prediction.
If you don’t have access to the Synerise Demo workspace, please leave your contact details in this form, and our representative will contact you shortly.