Find customers for a new offline shop branch
When you open a new branch of your offline store, you may want to implement a campaign that will encourage your customers to visit a new location. To find out who would be the best target of the campaign, you can use the Predictions module.
The business goal of this use case is to find a group of customers who will be the audience of a campaign released on the occasion of opening a new store in Waverly, the fourth shop branch in Lackawanna County.
The main action in this use case is comparison of a group of customers whose location is declared to be Waverly (target group) to the group of customers who made purchases in the offline branches of your shop - source group. After the prediction is complete, the customers from the target group will be recognized by the snr.lookalike.score event on their profiles and the score_label parameter of this event indicates the level of similarity to the source group.
Based on this event, you can create a group of customers with the highest score who will be the recipients of the campaign that is released for the shop branch opening. This way, you increase the chances of reaching those for whom the location of the shop branch is more convenient and encourage them to visit the shop.
Prerequisites
- Enable the Lookalikes prediction type
- Implement transaction events using SDK or API.
Process
In this use case, you will go through the following steps:
Create source segmentation
A source segmentation is a group of model customers to whom you compare the target group of customers in order to find similar customers in the target group.
-
Go to
 Analytics > Segmentations > New segmentation.
 -
Enter a meaningful name of the segmentation.
-
Click Choose filter.
-
From the drop down list, select the transaction event.
Tip: Events may have different labels between workspaces, but you can always find them by their action name (in this step, it’s transaction.charge). -
As the parameter, select
sourceand set its value toPOS. -
Using the date picker in the lower-right corner, select the date last 60 days.
-
Save the segmentation.
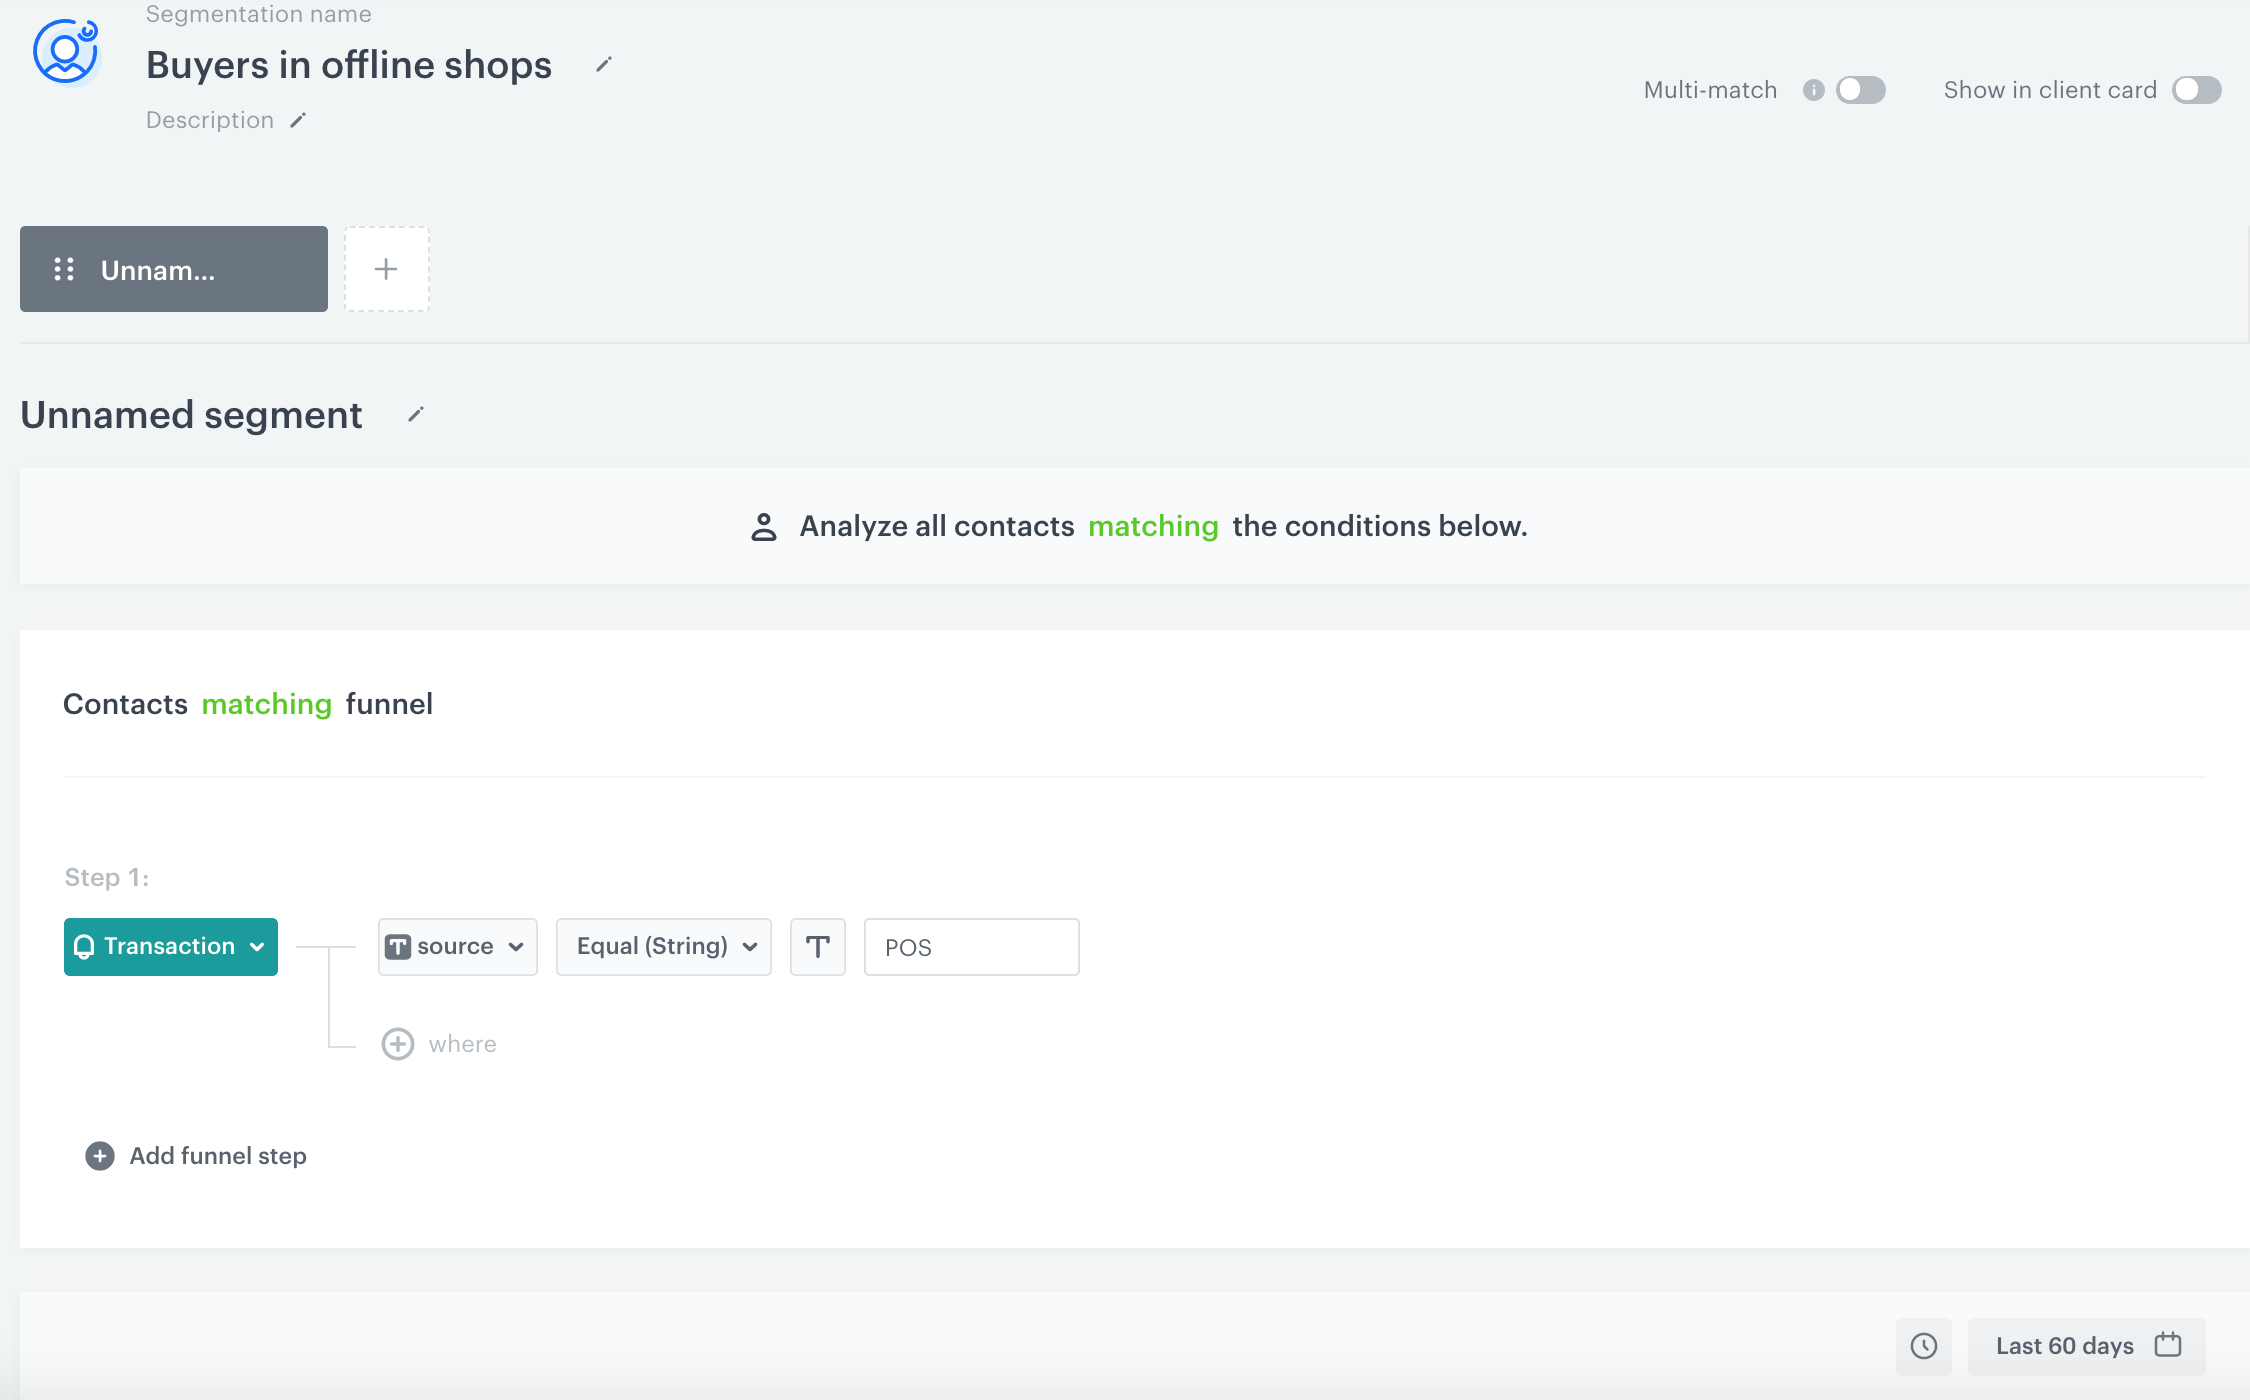
Configuration of the source segmentation
Create target segmentation
A target segmentation is a group of customers among which you want to find customers who are similar to those included in the source group.
- Go to Analytics > Segmentations > New segmentation.
- Enter a meaningful name of the segmentation.
- Click Choose filter.
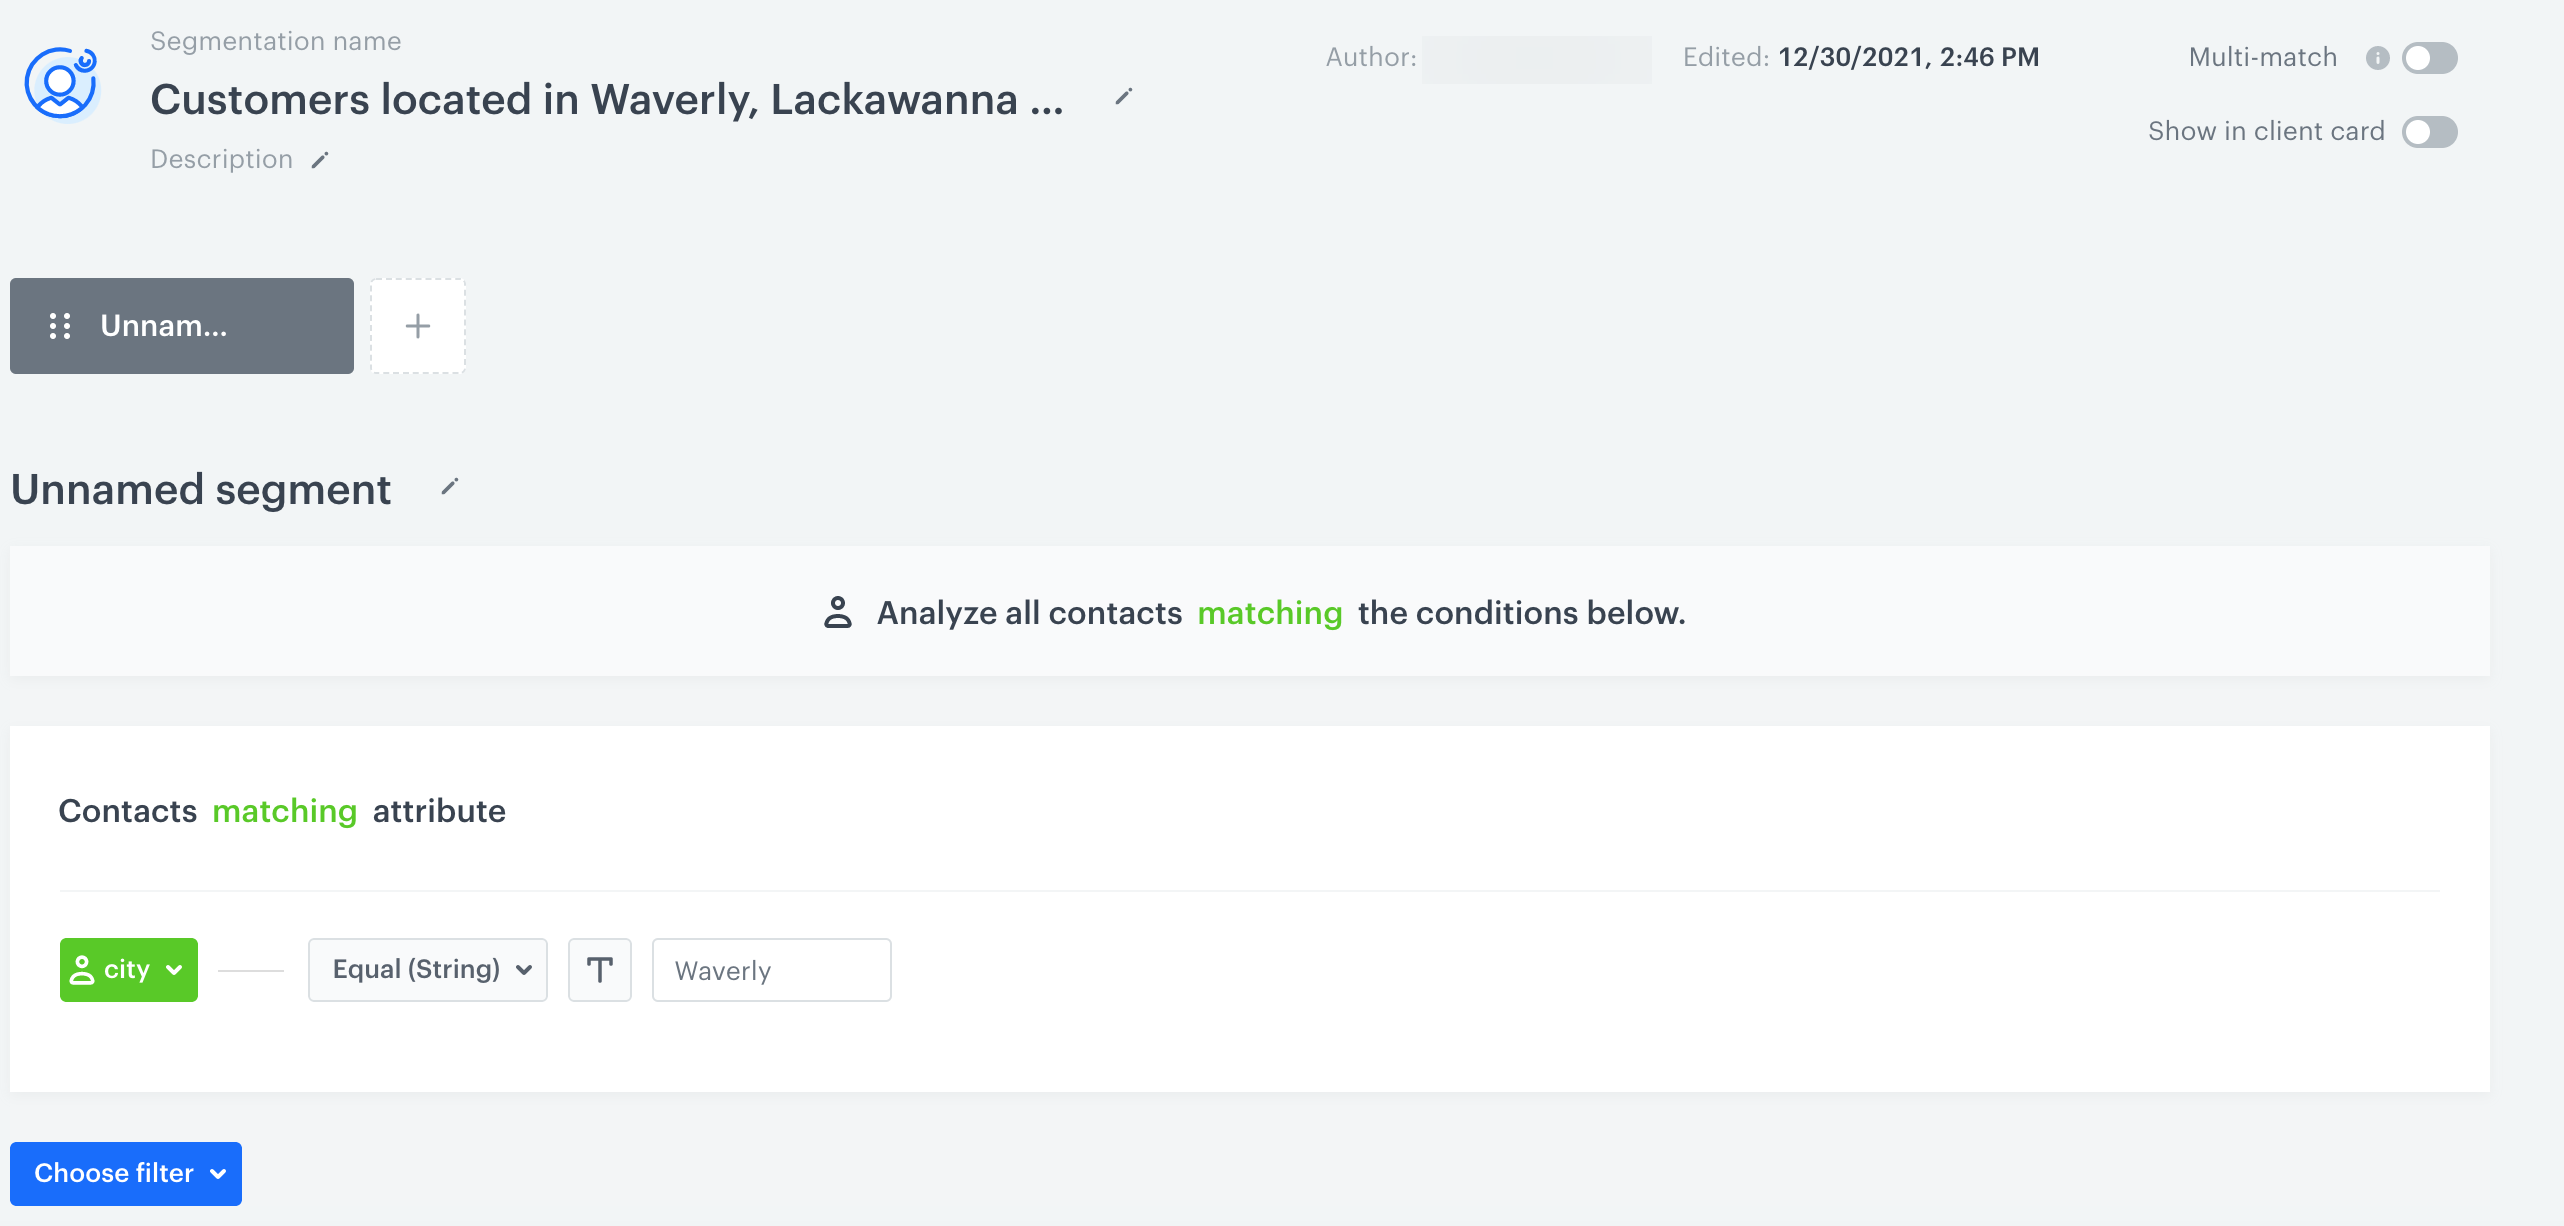
- From the dropdown list, select the city attribute.
- Set the attribute value to Waverly.
- Save the segmentation.
Create a prediction
In this part of the process, you create a prediction that uses the segmentations you created before.
- Go to
 > New prediction.
 - In the Select prediction type window that appears, click Lookalike.
- Click Apply.
- In the Audience section, click Define.
- In the Source segmentation subsection, click Choose segmentation.
- From the dropdown list, select the source segmentation you created before.
- In the Target segmentation subsection, click Choose segmentation.
- From the dropdown list, select the target segmentation you created before.
- Confirm by clicking Apply.
- In the Settings section, click Change.
- Enable the Set up recurring prediction calculation option.
- Set the recalculation of the prediction every 7 days. The segmentation is recalculated before a prediction is recalculated - recalculation of the segmentation concerns recurring predictions which intervals are longer than several hours.
- Select the 2-point scale.
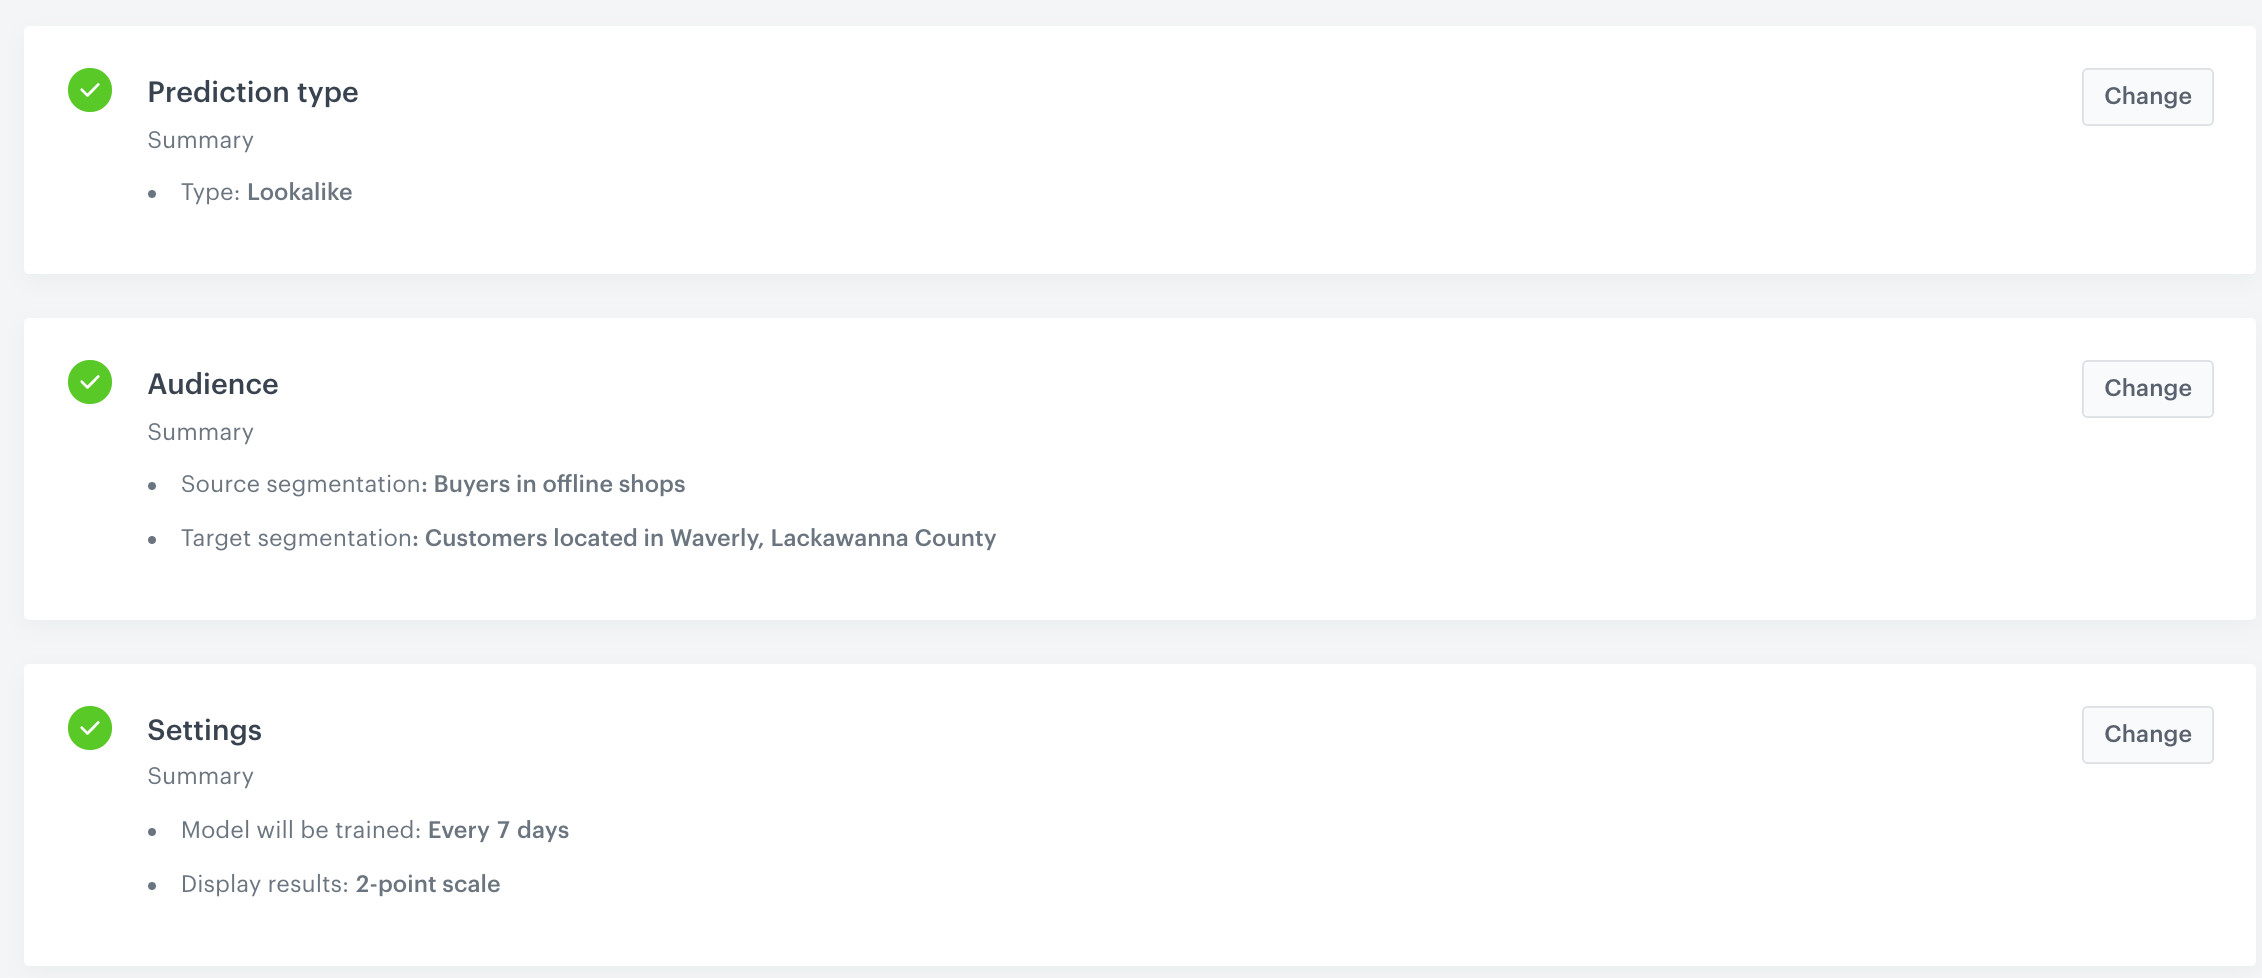
Configuration of the prediction - Confirm by clicking Apply.
- Click Save & Calculate.
What’s next
Based on the snr.lookalike.score event, you can create a segmentation for the Waverly opening campaign. To define the size of the recipient group, you can use the score_label parameter of the snr.lookalike.score with the score value set to high or use percentiles in order to address your communication to a specific percentage of target segment with the highest prediction score. Later you can use this segment in the following campaigns:
Email, SMS, web push and mobile push can be sent manually or you can launch them by using the Automation module.
Check the use case set up on the Synerise Demo workspace
You can find the analyses created in this use case in our Synerise Demo workspace at the following links:
- Segmentation of buyers in offline shops,
- Segmentation of customers from Warsaw,
- Lookalike prediction.
If you don’t have access to the Synerise Demo workspace, please leave your contact details in this form, and our representative will contact you shortly.