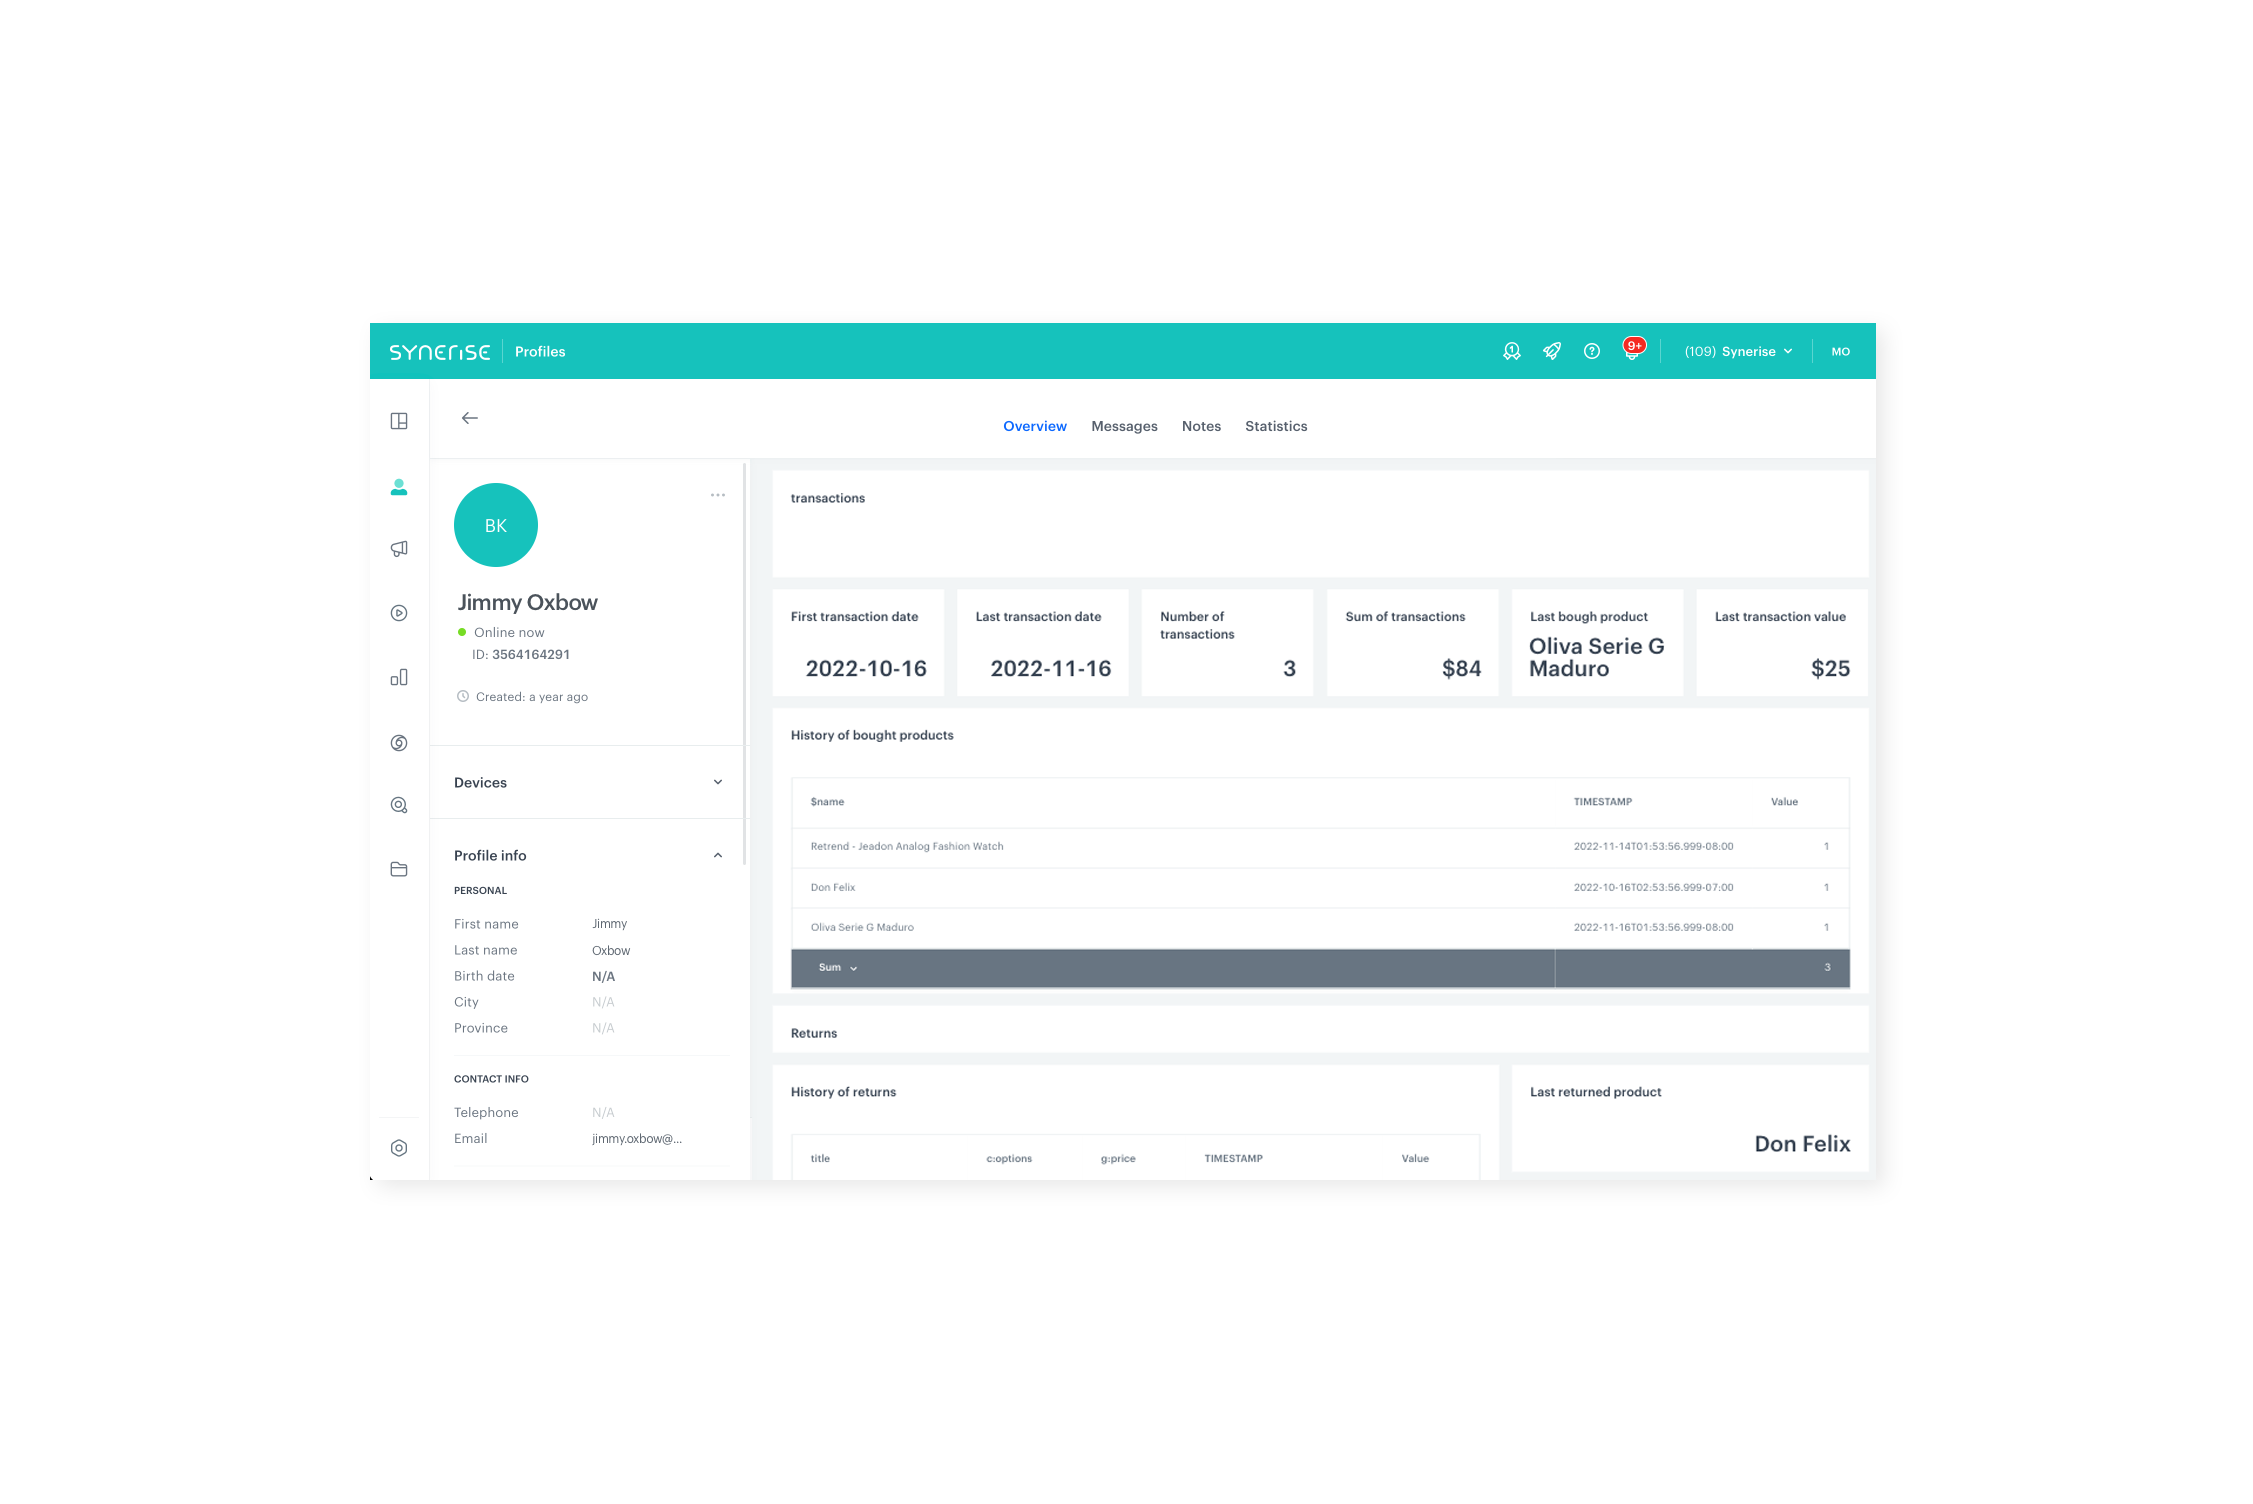
Call center dashboard
Creating a dashboard for call center is a great way for call center epmloyees to monitor day-to-day operations, customer buying history as well as their satisfaction based on various metrics and KPIs.
In this use case you will design a dashboard for call center personnel. It will be a reporting tool that shows call center-related analytics so you can monitor, optimize and improve contact with your customers. The goal of the visual presentation is to make analysis simpler by cutting down the time it takes to ingest information from hours to seconds.
Prerequisites
- Implement a tracking code on your website.
- Implement transaction events using SDK or API.
- Add custom events and their parameters to save data to customers’ profiles when they perform an activity.
In this particular use case:product.return,callcenter.call.
- Implement OG tags on your website.
Process
In this use case, you will go through the following steps:
- Create expressions that return the date of transaction, returns and page visit.
- Create aggregates for transactions, returns, visits to the website and call center history.
- Create metrics for bought products, returns, top visited brands, top visited products and queries.
- Create reports for history of bought products, returns, top visited brands, top visited products and history of queries.
- Create trends of history of calls.
- Create a dashboard that gathers created analyses.
- Add the dashboard to customer profiles.
Create expressions
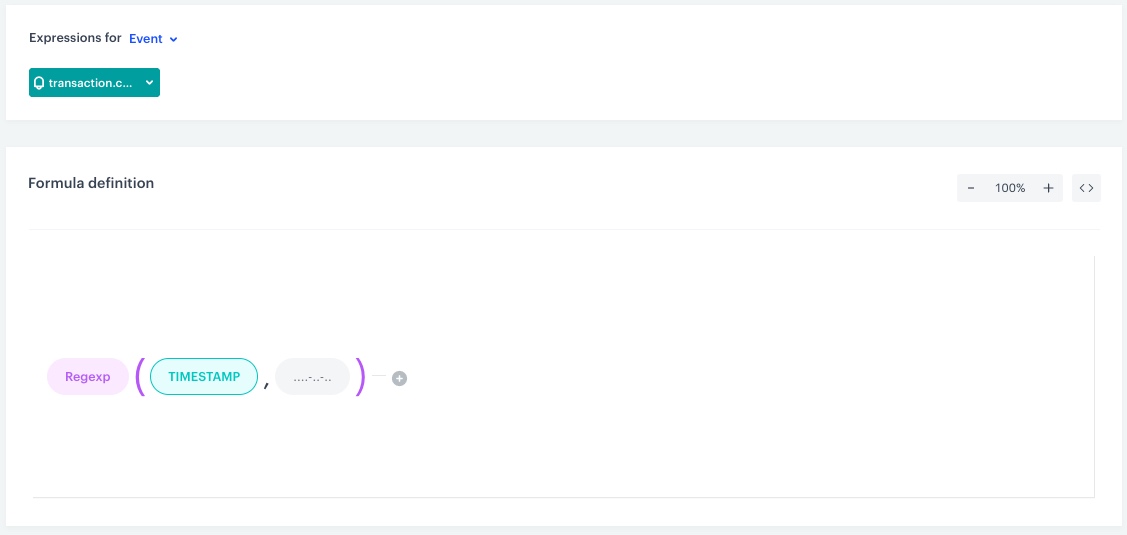
In this part of the process, create two expressions for the following events: transaction.charge and page.visit. They will be later used in aggregates to return dates of specific events.
- Go to
 Analytics > Expressions > New expression.
 - Enter the name of the expression.
- Set the Expression for option to Event.
- From the Choose event dropdown list, select
transaction.chargeevent. - In the Formula definition section, click Select.
- From the list that opens, select Function > Regexp.
- In the brackets, click the Select button and from the list, select Event attribute.
- Click the Unnamed node that appeared.
- At the bottom of the page, click Choose parameter.
- In the list of attributes, find and select TIMESTAMP.
- Click the next Select button in the brackets and from the list, select Constant.
- Click the 0 node that appeared.
- At the bottom of the page, type
....-..-..for date format.
- Save the expression.
- Create a second expression and repeat all steps for
page.visitevent.
Create aggregates
In this part of the process, you will create a number of aggregates on transactions, returns, page visits and call center calls, which will be used in the dashboard in the further part of the process.
Transactions
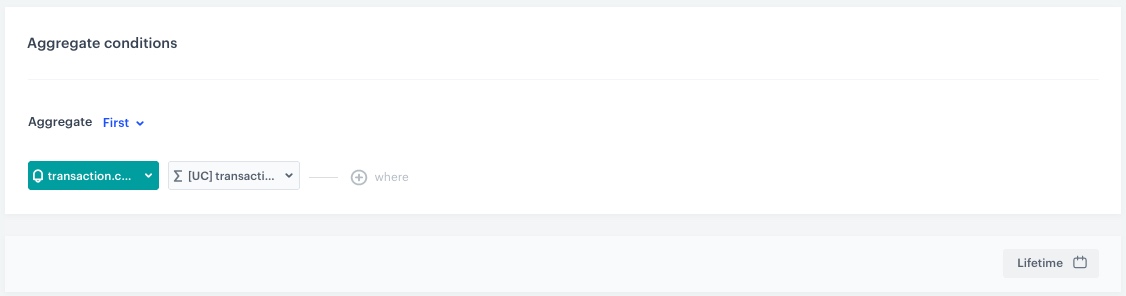
Create aggregate that:
- Go to Analytics > Aggregates > New aggregate.
- Enter a meaningful name of the aggregate.
- Switch the Show in profile card option on.
- Set the Aggregate option to First to return the date of first transaction.
- Click the Choose event dropdown list.
- From the dropdown list, select the
transaction.chargeevent. - Click choose parameter and search for the expression created in the previous part of the process regarding the chosen event.
- Using the date picker in the lower-right corner, set the time range to Lifetime.
- Click Apply.
- Save the aggregate.
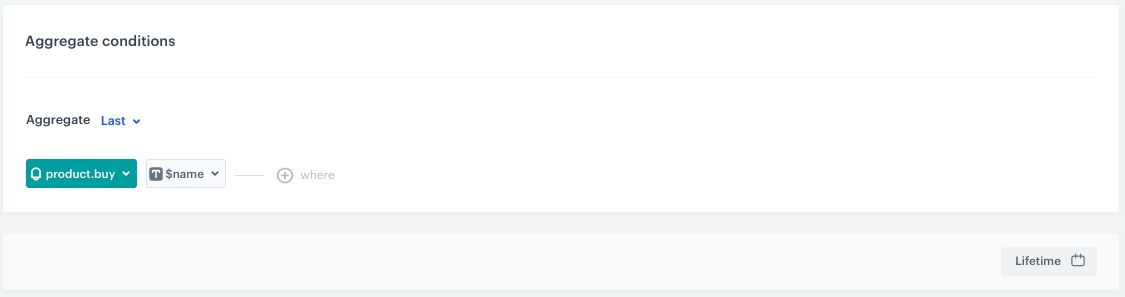
- Create a second aggregate and repeat all steps for Last option, to return the date of last transaction.
- Go to Analytics > Aggregates > New aggregate.
- Enter a meaningful name of the aggregate.
- Switch the Show in profile card option on.
- Set the Aggregate option to Last to return the name of the last bought product.
- Click the Choose event dropdown list.
- From the dropdown list, select the
product.buyevent. - Click choose parameter and choose the
$nameparameter. - Using the date picker in the lower-right corner, set the time range to Lifetime.
- Click Apply.
- Save the aggregate.
- Go to Analytics > Aggregates > New aggregate.
- Enter a meaningful name of the aggregate.
- Switch the Show in profile card option on.
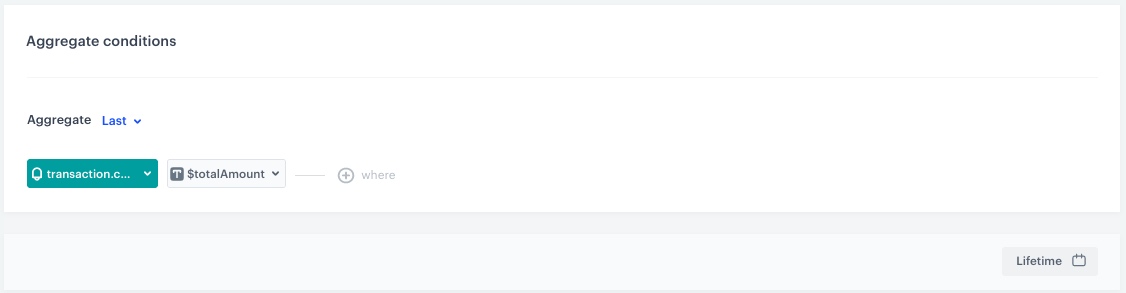
- Set the Aggregate option to Last to return the value of the last transaction customer made.
- Click the Choose event dropdown list.
- From the dropdown list, select the
transaction.chargeevent. - Click choose parameter and choose the
$totalAmountparameter. - Using the date picker in the lower-right corner, set the time range to Lifetime.
- Click Apply.
- Save the aggregate.
- Go to Analytics > Aggregates > New aggregate.
- Enter a meaningful name of the aggregate.
- Switch the Show in profile card option on.
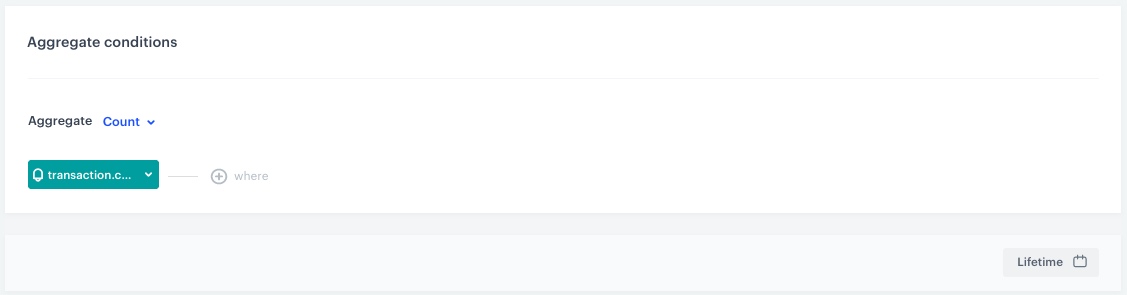
- Set the Aggregate option to Count to return the number of all the transactions customer made.
- Click the Choose event dropdown list.
- From the dropdown list, select the
transaction.chargeevent. - Using the date picker in the lower-right corner, set the time range to Lifetime.
- Click Apply.
- Save the aggregate.
- Go to Analytics > Aggregates > New aggregate.
- Enter a meaningful name of the aggregate.
- Switch the Show in profile card option on.
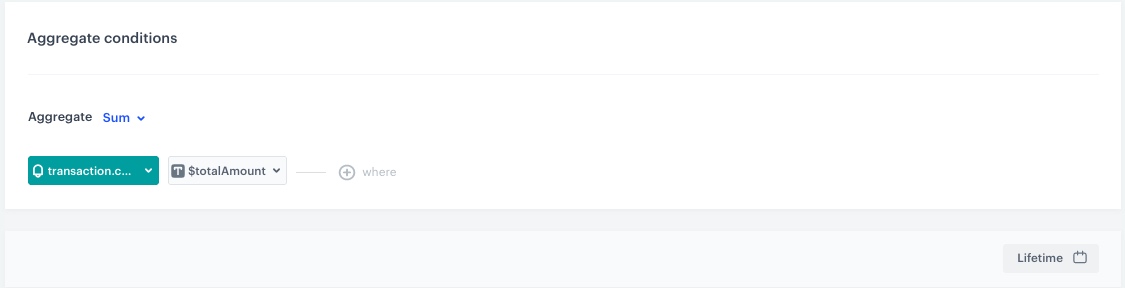
- Set the Aggregate option to Sum to return the value of all the transactions customer made.
- Click the Choose event dropdown list.
- From the dropdown list, select the
transaction.chargeevent. - Click choose parameter and choose the
$totalAmountparameter. - Using the date picker in the lower-right corner, set the time range to Lifetime.
- Click Apply.
- Save the aggregate.
Returns
Create an aggregate that:
- Go to Analytics > Aggregates > New aggregate.
- Enter a meaningful name of the aggregate.
- Switch the Show in profile card option on.
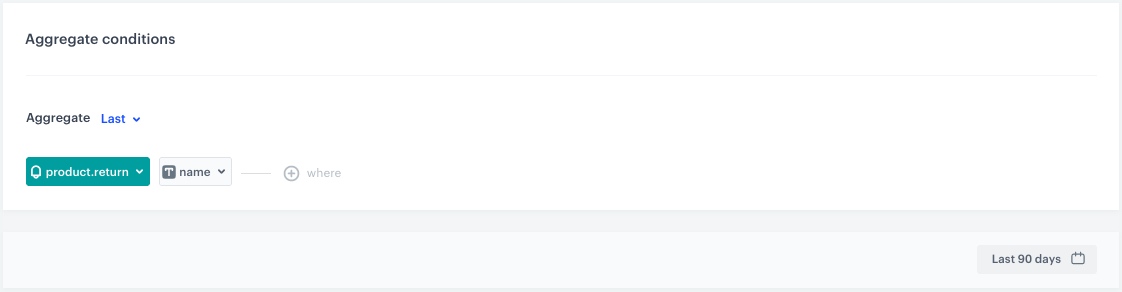
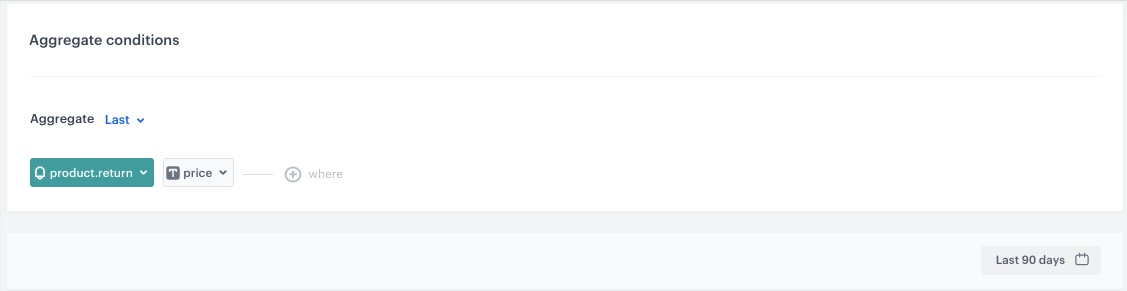
- Set the Aggregate option to Last to display the last product a customer returned.
- Click the Choose event dropdown list.
- From the dropdown list, select the
product.returnevent. - Click choose parameter and choose the
nameparameter. - Using the date picker in the lower-right corner, set the time range to Custom and set to 90 days.
- Click Apply.
- Save the aggregate.
- Go to Analytics > Aggregates > New aggregate.
- Enter a meaningful name of the aggregate.
- Switch the Show in profile card option on.
- Set the Aggregate option to Last to display the price of the last product a customer returned.
- Click the Choose event dropdown list.
- From the dropdown list, select the
product.returnevent. - Click choose parameter and choose the
priceparameter. - Using the date picker in the lower-right corner, set the time range to Custom and set to 90 days or according to your business needs.
- Click Apply.
- Save the aggregate.
Web activities
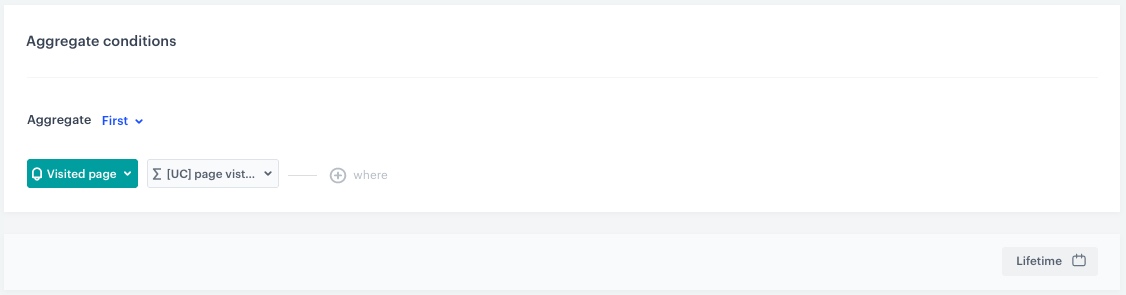
In this part of the process, create an aggregate that returns the date of the first or last visit to the web page.
- Go to Analytics > Aggregates > New aggregate.
- Enter a meaningful name of the aggregate.
- Switch the Show in profile card option on.
- Set the Aggregate option to First or Last to return the date of the first or last date customer visited the web page.
- Click the Choose event dropdown list.
- From the dropdown list, select the
page.visitevent. - Click choose parameter and search for the expression created in the previous part of the process regarding the chosen event.
- Using the date picker in the lower-right corner, set the time range to Lifetime.
- Click Apply.
- Save the aggregate.
Contact Center
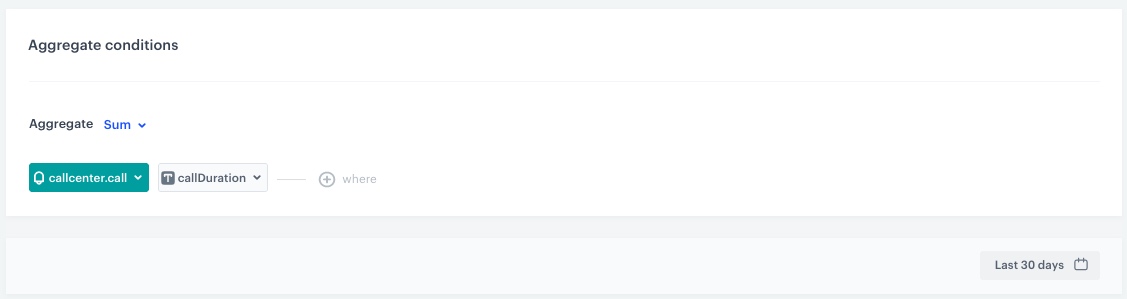
In this part of the process, create aggregate that returns the time of call center calls.
- Go to Analytics > Aggregates > New aggregate.
- Enter a meaningful name of the aggregate.
- Switch the Show in profile card option on.
- Set the Aggregate option to Sum to return the time of call center calls.
- Click the Choose event dropdown list.
- From the dropdown list, select the
callcenter.callevent. - Click choose parameter and choose the
callDurationparameter. - Using the date picker in the lower-right corner, set the time range to Custom and set to 30 days or according to your business needs.
- Click Apply.
- Save the aggregate.
Create metrics
In this part of the process, you will create five metrics for the following events: product.buy, product.return, page.visit and item.search. They will be later used in reports.
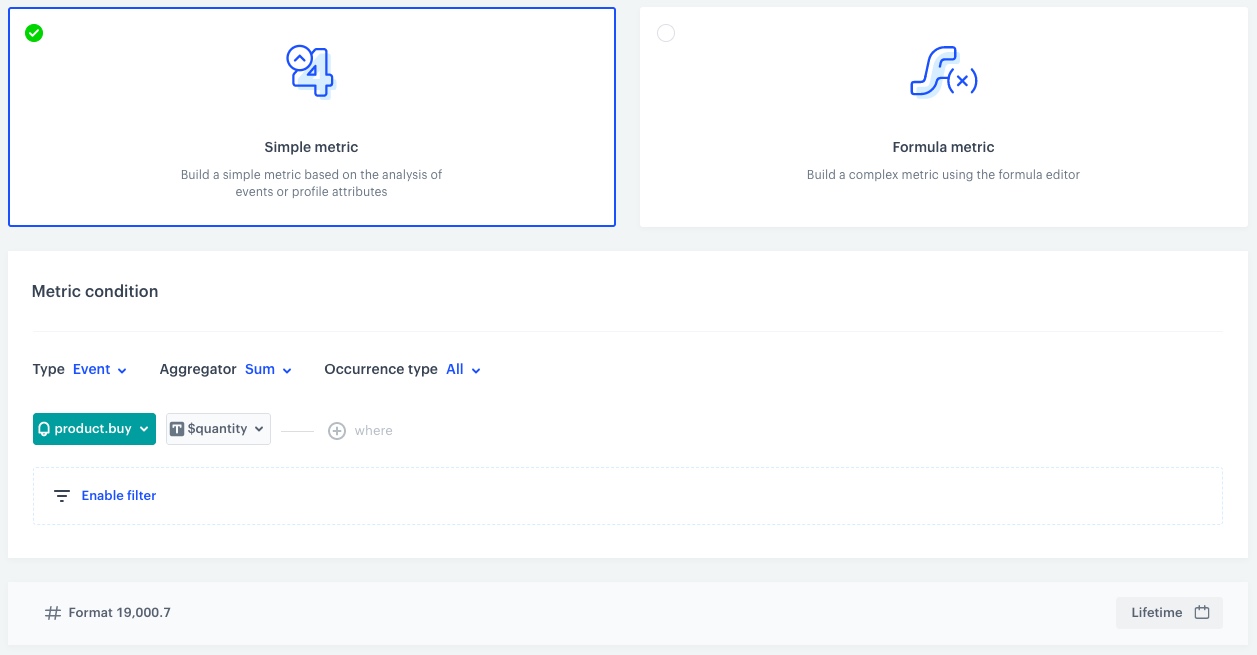
Number of bought products
This metric will return the number of all products bought by a customer.
- Go to Analytics > Metrics > New metric.
- Enter the name of the metric.
- As a metric kind, select Simple metric.
- As the type, set Event.
- As the aggregator, set Sum.
- As the occurrence type, set All.
- From the Choose event dropdown list, select
product.buy. - Click
 button.
Result: The Choose parameter button appears. - From the Choose parameter dropdown list, choose
$quantity. - To select a specific time range, click the calendar icon. In our case it will be Lifetime. Confirm your choice with the Apply button.
- Click Save.
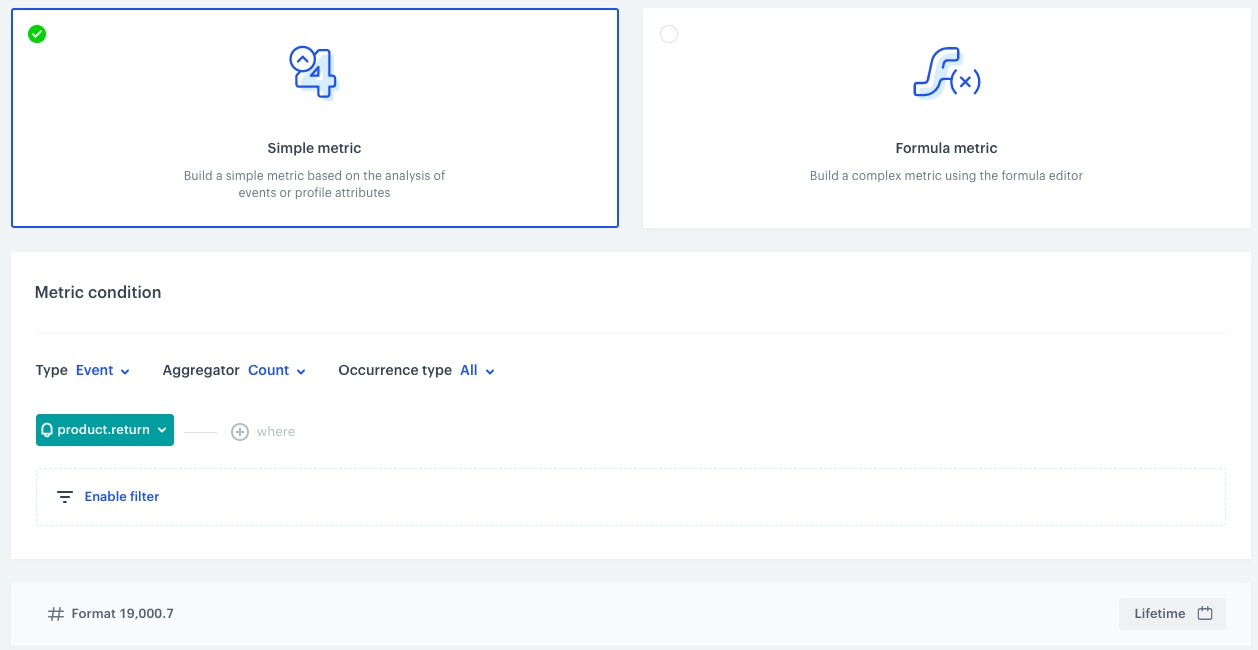
Number of returned products
This metric will return the number of all products returned by a customer.
- Go to Analytics > Metrics > New metric.
- Enter the name of the metric.
- As a metric kind, select Simple metric.
- As the type, set Event.
- As the aggregator, set Count.
- As the occurrence type, set All.
- From the Choose event dropdown list, select
product.return. - To select a specific time range, click the calendar icon. In our case it will be Lifetime. Confirm your choice with the Apply button.
- Click Save.
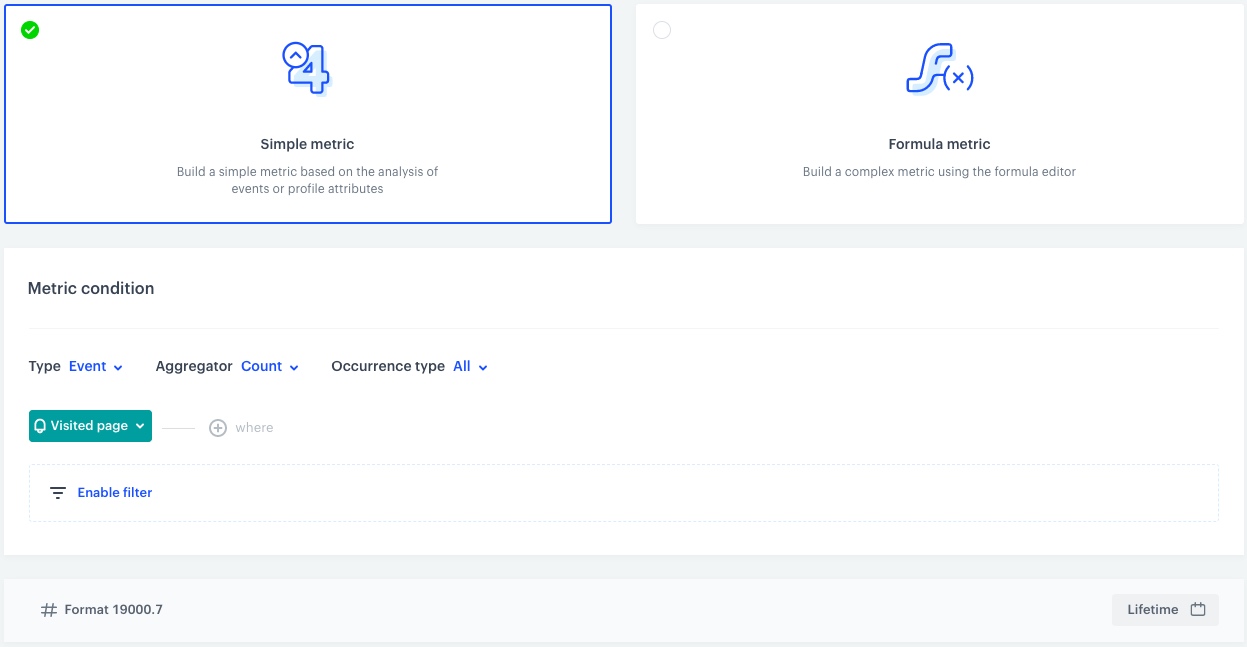
Number of page visits
This metric will return the number of all page visits made by a customer.
- Go to Analytics > Metrics > New metric.
- Enter the name of the metric.
- As a metric kind, select Simple metric.
- As the type, set Event.
- As the aggregator, set Count.
- As the occurrence type, set All.
- From the Choose event dropdown list, select
page.visit. - To select a specific time range, click the calendar icon. In our case it will be Lifetime. Confirm your choice with the Apply button.
- Click Save.
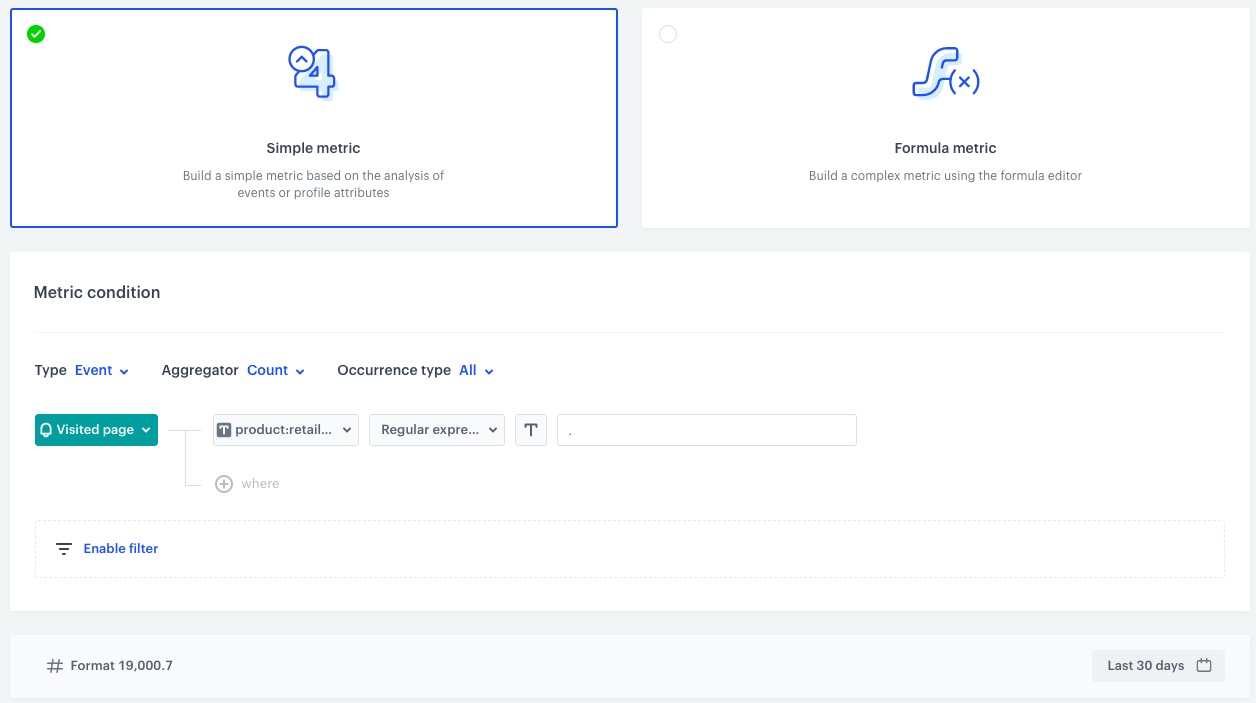
Number of visited products
This metric will return the number of all products visited by a customer.
- Go to Analytics > Metrics > New metric.
- Enter the name of the metric.
- As a metric kind, select Simple metric.
- As the type, set Event.
- As the aggregator, set Count.
- As the occurrence type, set All.
- From the Choose event dropdown list, select
page.visit. - Click button.
Result: The Choose parameter button appears. - From the Choose parameter dropdown list, choose
product:retailer_part_no. - From the Choose operator dropdown list, select Regular expression (String).
- In the text field type
. - Using the date picker in the lower-right corner, set the time range to Lifetime. Confirm your choice with the Apply button.
- Click Save.
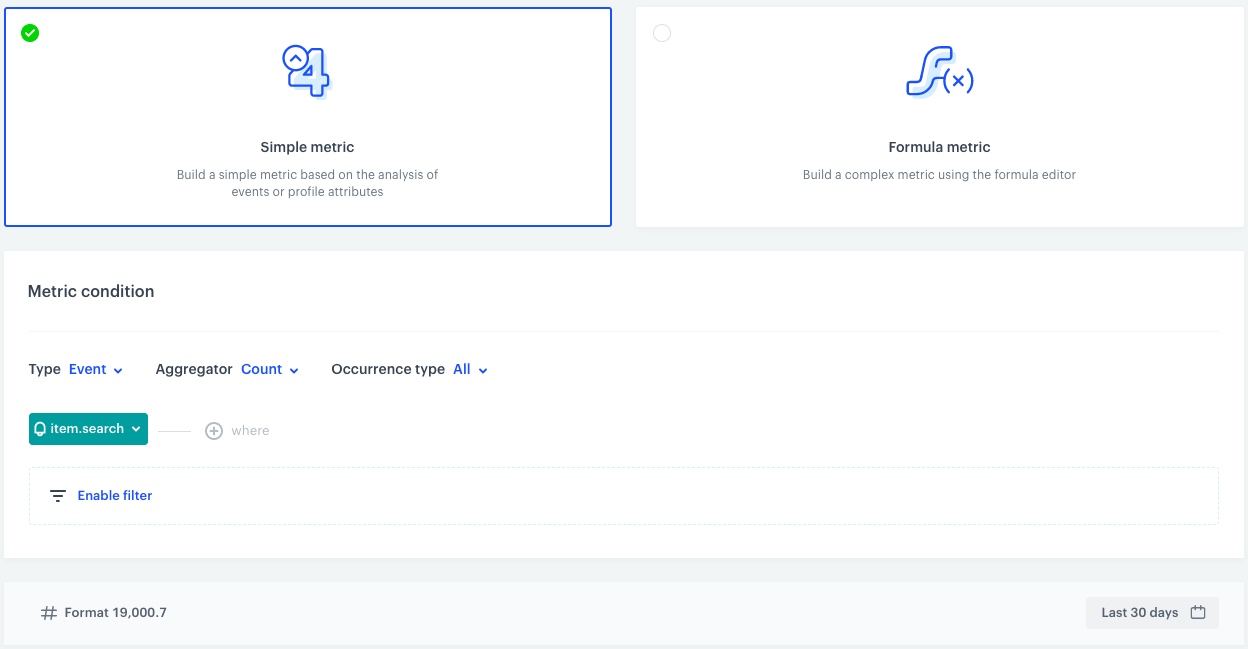
Number of searched items
This metric will return the number of all products searched by a customer.
- Go to Analytics > Metrics > New metric.
- Enter the name of the metric.
- As a metric kind, select Simple metric.
- As the type, set Event.
- As the aggregator, set Count.
- As the occurrence type, set All.
- From the Choose event dropdown list, select
item.search. - Using the date picker in the lower-right corner, set the time range to Custom and set to 30 days or according to your business needs. Confirm your choice with the Apply button.
- Click Save.
Create reports
In this part of the process, you will create reports on transactions, returns and web activities which will be used in the dashboard in the further part of the process.
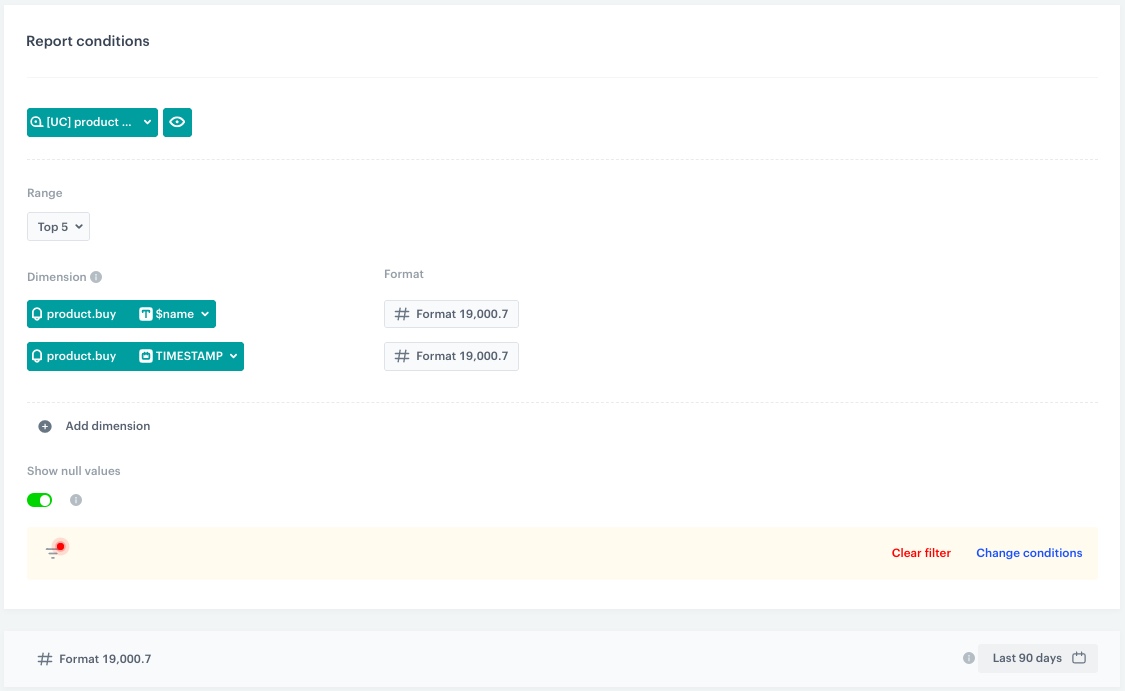
History of bought products
This report will return the name of all products bought by a customer and the time of their purchase.
-
Go to
Analytics > Reports > New report. -
Enter a meaningful name of the report.
-
Click the Choose metric and from the dropdown list, select a metric for number of bought products, created in the previous part of the process.
-
From the Range dropdown list, select the number of top (the most frequently bought) products to be shown in the preview of the report. In this case it will be TOP 5 products.
-
In the Dimension section, from the dropdown list, select Event > Parameters. To be able to show products name in the report, choose
$name. -
Click Add dimension.
- Click Choose dimension and from the dropdown list, select Event > Specials. To be able to show when the product wast bought, choose
TIMESTAMP.
- Click Choose dimension and from the dropdown list, select Event > Specials. To be able to show when the product wast bought, choose
-
Click Enable filter.
- Click Choose filter and from the dropdown list, select CLIENT_ID.
- Click Choose operator and from the dropdown list, select Equal (String).
- Change the type of value by clicking the icon until you get
 .
. - In the first field, write
clientIdand in the second field enter. - Click Apply.
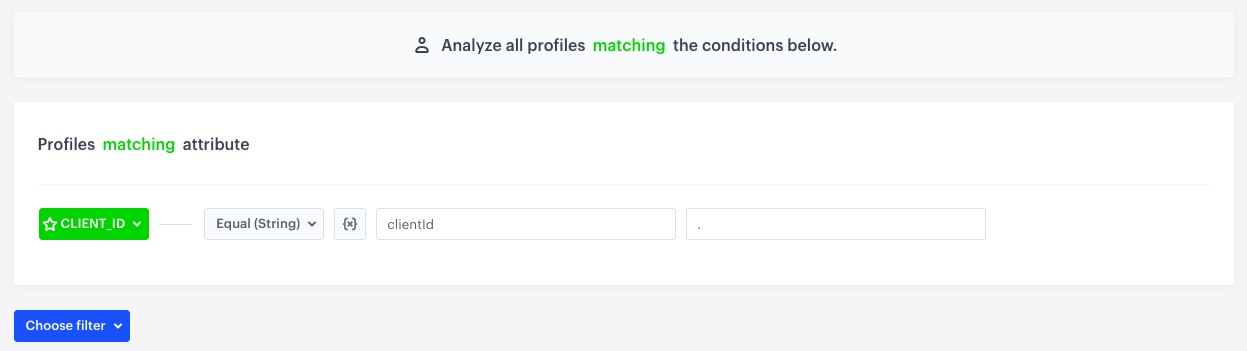
Configuration of the filter in report -
Using the date picker in the lower-right corner, set the time range to Custom and set to 90 days or according to your business needs. Confirm your choice with the Apply button.
-
Save the report.
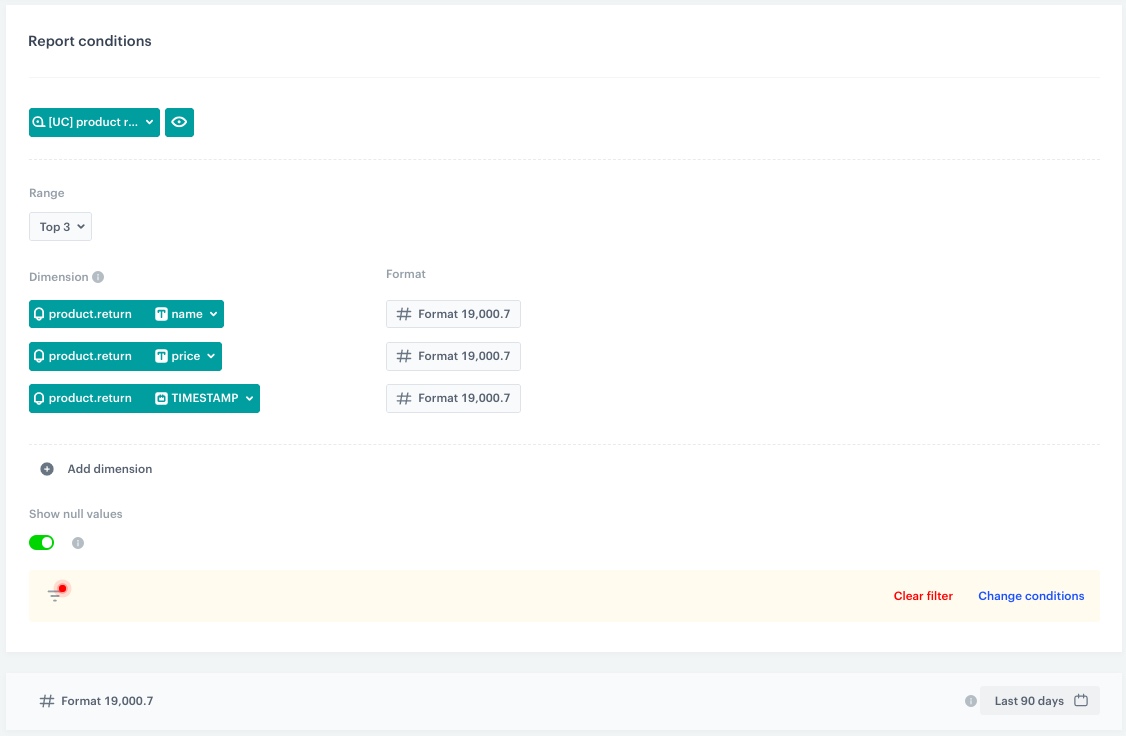
History of returned products
This report will return the name of all products returned by a customer, their price and the time of return.
- Go to Analytics > Reports > New report.
- Enter a meaningful name of the report.
- Click the Choose metric and from the dropdown list, select a metric for number of returned products, created in the previous part of the process.
- From the Range dropdown list, select the number of top (the most frequently returned) products to be shown in the preview of the report. In this case, it will be TOP 3 products.
- In the Dimension section, from the dropdown list, select Event > Parameters. To be able to show products name in the report, choose
name. - Click Add dimension.
- Click Choose dimension and from the dropdown list, select Event > Parameters. To be able to show what the product price is, choose
price.
- Click Choose dimension and from the dropdown list, select Event > Parameters. To be able to show what the product price is, choose
- Click Add dimension.
- Click Choose dimension and from the dropdown list, select Event > Specials. To be able to show when the product was returned, choose
TIMESTAMP.
- Click Choose dimension and from the dropdown list, select Event > Specials. To be able to show when the product was returned, choose
- Click Enable filter.
- Click Choose filter and from the dropdown list, select CLIENT_ID.
- Click Choose operator and from the dropdown list, select Equal (String).
- Change the type of value by clicking the icon until you get .
- In the first field, write
clientIdand in the second field enter. - Click Apply.
- Using the date picker in the lower-right corner, set the time range to Custom and set to 90 days or according to your business needs. Confirm your choice with the Apply button.
- Save the report.
Top visited brands
This report will return the name of the most frequently visited brands by a customer and the number of visits.
- Go to Analytics > Reports > New report.
- Enter a meaningful name of the report.
- Click the Choose metric and from the dropdown list, select a metric for number of all page visits, created in the previous step
- From the Range dropdown list, select the number of top (the most frequently viewed) products to be shown in the preview of the report. In this case it will be TOP 5 products.
- In the Dimension section, from the dropdown list select Event > Parameters. To be able to show product’s brand in the report, choose
brand. - Click Enable filter.
- Click Choose filter and from the dropdown list, select CLIENT_ID.
- Click Choose operator and from the dropdown list, select Equal (String).
- Change the type of value by clicking the icon until you get .
- In the first field, write
clientIdand in the second field, enter. - Click Apply.
- Using the date picker in the lower-right corner, set the time range to Custom and set to 30 days or according to your business needs. Confirm your choice with the Apply button.
- Save the report.

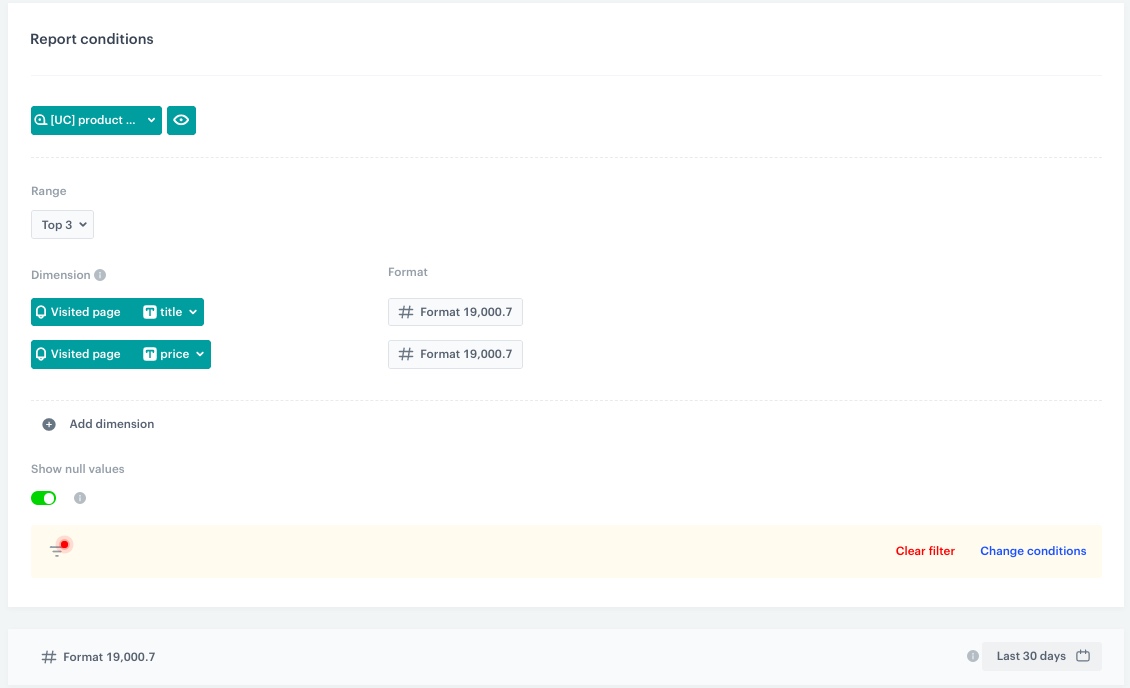
Top visited products
This report will return the name of most visited products by a customer, their price, and the number of visits.
- Go to Analytics > Reports > New report.
- Enter a meaningful name of the report.
- Click the Choose metric and from the dropdown list, select a metric for number of all visited products, created in the previous step
- From the Range dropdown list, select the number of top (the most frequently visited) products to be shown in the preview of the report. In this case, it will be TOP 5 products.
- In the Dimension section, from the dropdown list, select Event > Parameters. To be able to show products name in the report, choose
title. -
- Click Add dimension.
- Click Choose dimension and from the dropdown list, select Event > Parameters. To be able to show the product’s price, choose
price.
- Click Enable filter.
- Click Choose filter and from the dropdown list, select CLIENT_ID.
- Click Choose operator and from the dropdown list, select Equal (String).
- Change the type of value by clicking the icon until you get .
- In the first field, write
clientIdand in the second field, enter. - Click Apply.
- Using the date picker in the lower-right corner, set the time range to Custom and set to 30 days or according to your business needs. Confirm your choice with the Apply button.
- Save the report.
Searched queries
This report will return the name of the most frequently searched queries by a customer and the number of searches.
- Go to Analytics > Reports > New report.
- Enter a meaningful name of the report.
- Click the Choose metric and from the dropdown list, select a metric for number of all searched items, created in the previous step
- From the Range dropdown list, select the number of top (the most frequently searched) phrases to be shown in the preview of the report. In this case, it will be TOP 10.
- In the Dimension section, from the dropdown list, select Event > Parameters. To be able to show the searched query in the report, choose
query. - Click Enable filter.
- Click Choose filter and from the dropdown list, select CLIENT_ID.
- Click Choose operator and from the dropdown list, select Equal (String).
- Change the type of value by clicking the icon until you get .
- In the first field, write
clientIdand in the second field, enter. - Click Apply.
- Using the date picker in the lower-right corner, set the time range to Custom and set to 30 days or according to your business needs. Confirm your choice with the Apply button.
- Save the report.

Create trends
In this part of the process, you will create trends on history of page visits and call center calls.
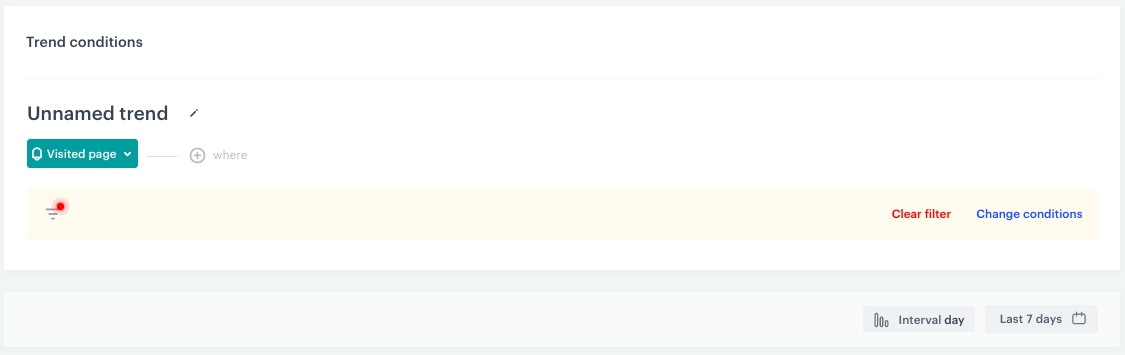
Visits on the website
This trend will show number of customer visits to the webiste over a specific time frame.
- Go to Analytics > Trends > New trends.
- Enter a meaningful name of the trend.
- Click the Choose event button and from the dropdown list, select
page.visit. - Click Enable filter.
- Click Choose filter and from the dropdown list, select CLIENT_ID.
- Click Choose operator and from the dropdown list, select Equal (String).
- Change the type of value by clicking the icon until you get .
- In the first field, write
clientIdand in the second field, enter. - Click Apply.
- Set the Interval in the lower-right conrer to day.
- Using the date picker in the lower-right corner, set the time range to Last 7 days or according to your business needs. Confirm your choice with the Apply button.
- Save the trend.
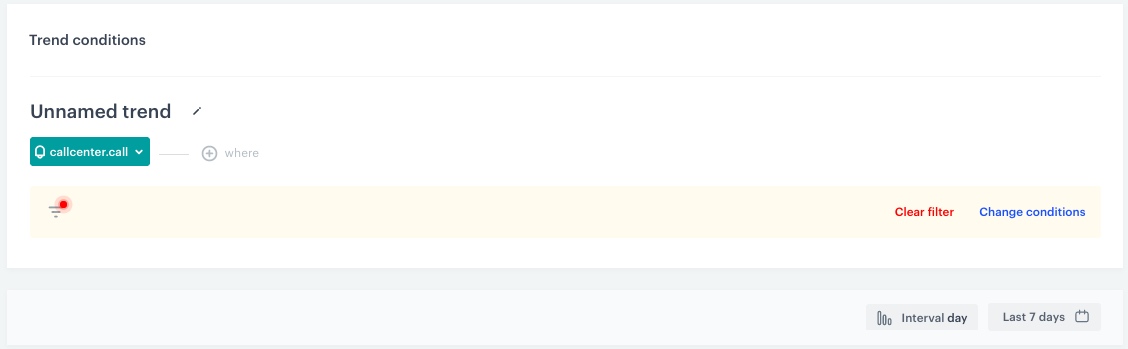
History of calls
This trend will show the number of customer call center calls over a specific time frame.
- Go to Analytics > Trends > New trends.
- Enter a meaningful name of the trend.
- Click the Choose event and from the dropdown list, select
callcenter.call. - Click Enable filter.
- Click Choose filter and from the dropdown list, select CLIENT_ID.
- Click Choose operator and from the dropdown list, select Equal (String).
- Change the type of value by clicking the icon until you get .
- In the first field write
clientIdand in the second field enter. - Click Apply.
- Set the Interval in the lower-right conrer to day.
- Using the date picker in the lower-right corner, set the time range to Last 7 days or according to your business needs. Confirm your choice with the Apply button.
- Save the trend.
Create a dashboard
In the final part of the process you will create a dashboard with aggregates, reports and trends created in previous steps.
-
Go to
Analytics > Dashboards > Add dashboard. -
Enter the name of the dashboard.
-
To add a widget to the dashboard, click an icon on the
 panel. The icons are (left to right): HTML code, text field, image, segmentation, trend, funnel, metric, histogram, aggregate, expression, and a report.Tip: You can create the dashboard by grouping the created analytics in sections: Transactions, Returns, Web Activities, Call Center. You can create custom template according to your business needs with the help of this article or follow the sample instructions below.
 -
Click the Text icon on the panel. Result: A Text widget will appear on the blank dashboard.
-
You can edit widget contents with the editor on the right. In the Title field type
Transactions, you can add a Description below.Tip: You can adjust the size of widgest by dragging their lower right corner.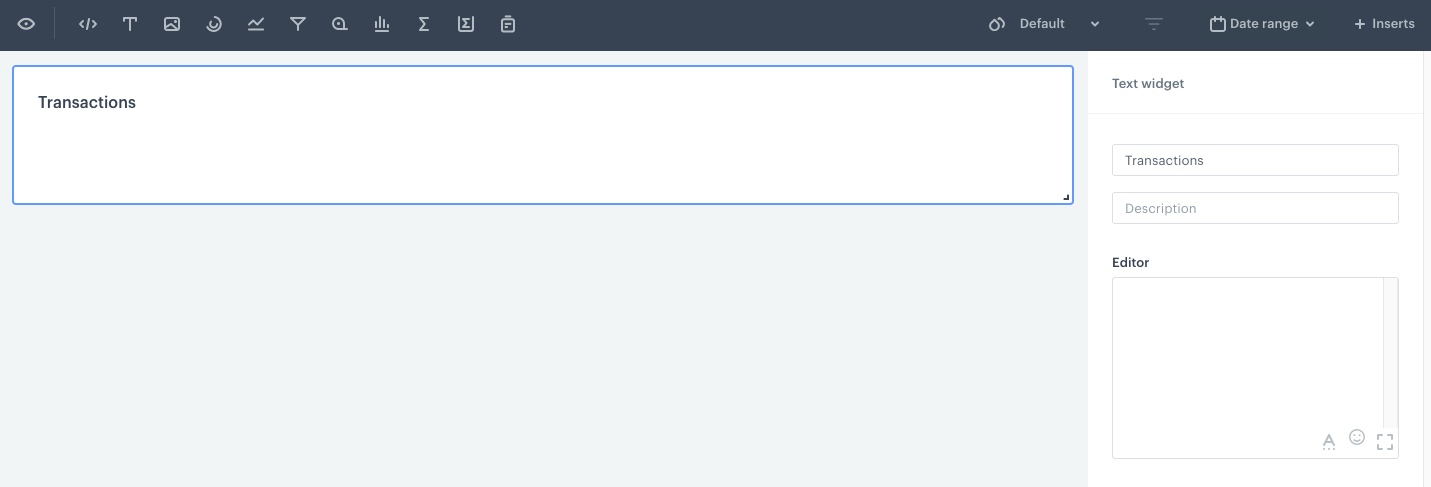
Configuration of the text widget -
Add an aggregate by clicking the Aggregate icon on the panel.
-
Edit widgets contents with the editor on the right. In the Aggregate section choose the aggregate that returns the date of the first transaction made by customer you have created in the previous part of the process. You can change the title and description. Do the same for the following aggregates created in the previous part of the process: the date of the last transaction, last bought product, last transaction value, number of transactions, value of all transactions.
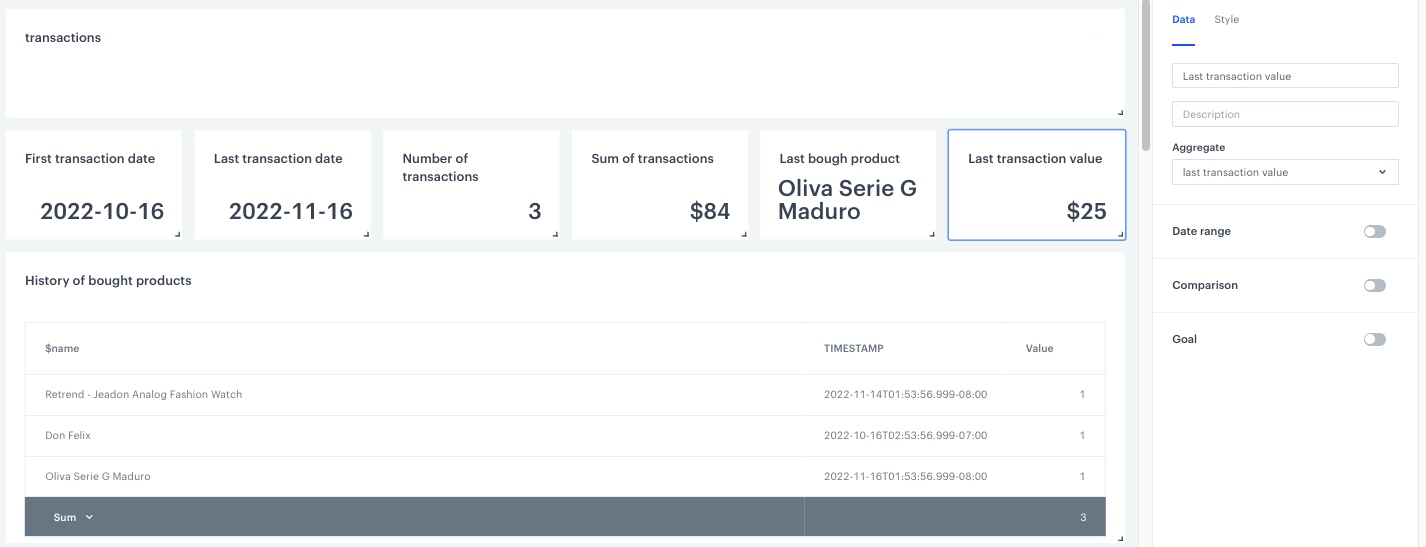
Configuration of the aggregate widget -
Add a report by clicking the Report icon on the panel.
-
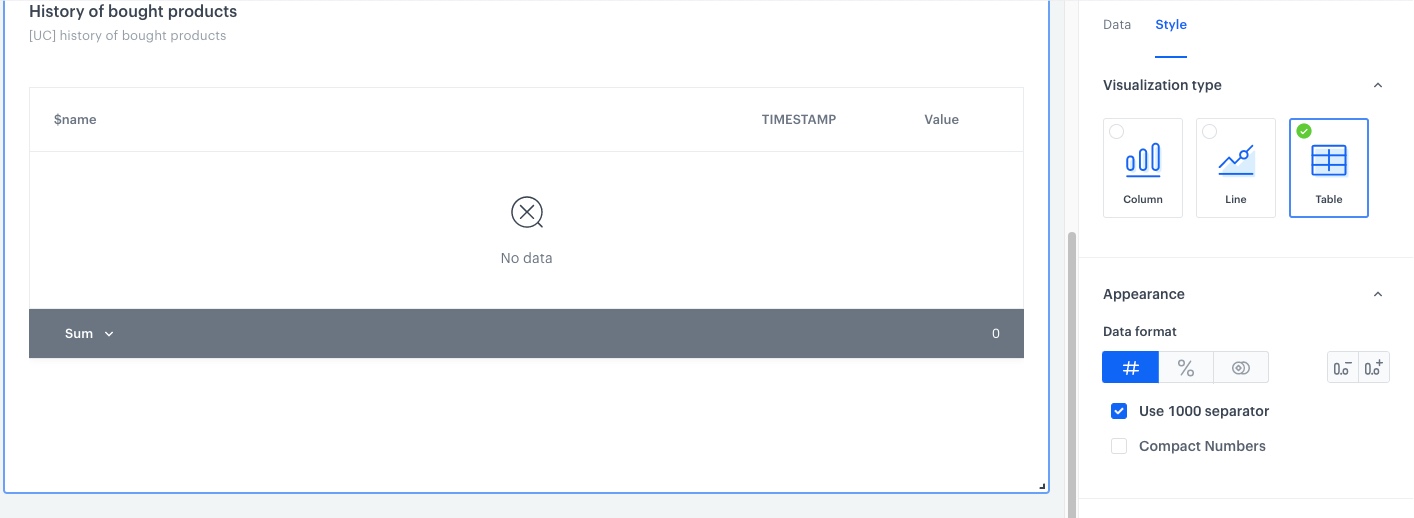
Edit widgets contents with the editor on the right. In the Report section choose the report on history of bought products you have created in the previous part of the process. You can change the title and description.
-
Click the Style section in the widget editor and change Visualization type to Table.
Configuration of the report widget -
Repeat steps 4 to 10 to create another sections: Returns, Web activities and Call Center.
Note: You can look up the sample dashboard created in the Demo workspace here -
When you complete creating the dashboard, click Save dashboard.
Tip: By default, a new dashboard is private. If you want to share it with others, check the instruction here.
Add the dashboard to customer profiles
Optionally, you can add the dashboard to customer profiles.
clientId. Aggregates and expressions don’t need clientId because they already contain it.- Go to
 Profiles and select a customer on the list.
 - On the top of the activity list, click Statistics.
Result: A set of statistics appears. - On the top of statistics, click the
 icon.
icon.
Result: A dropdown list appears. - Select Manage dashboards.
Result: A pop up appears. - On the top of the pop-up, click Add dashboard.
Result: A dropdown list appears. - From the dropdown list, select a dashboard.
- To confirm your choice, click Add.
Result: The dashboard appears on the bottom of the list. - To manage the order of the dashboards added to the customer’s profile, drag and drop them in the preferred order.
- To save the changes, click Apply.
Check the use case set up on the Synerise Demo workspace
You can check all configurations directly in Synerise Demo workspace:
- Expressions
- Aggregates
- Metrics
- Reports
- Trends
- Dashboard
If you don’t have access to the Synerise Demo workspace, please leave your contact details in this form, and our representative will contact you shortly.