Previewing Sankey Diagrams
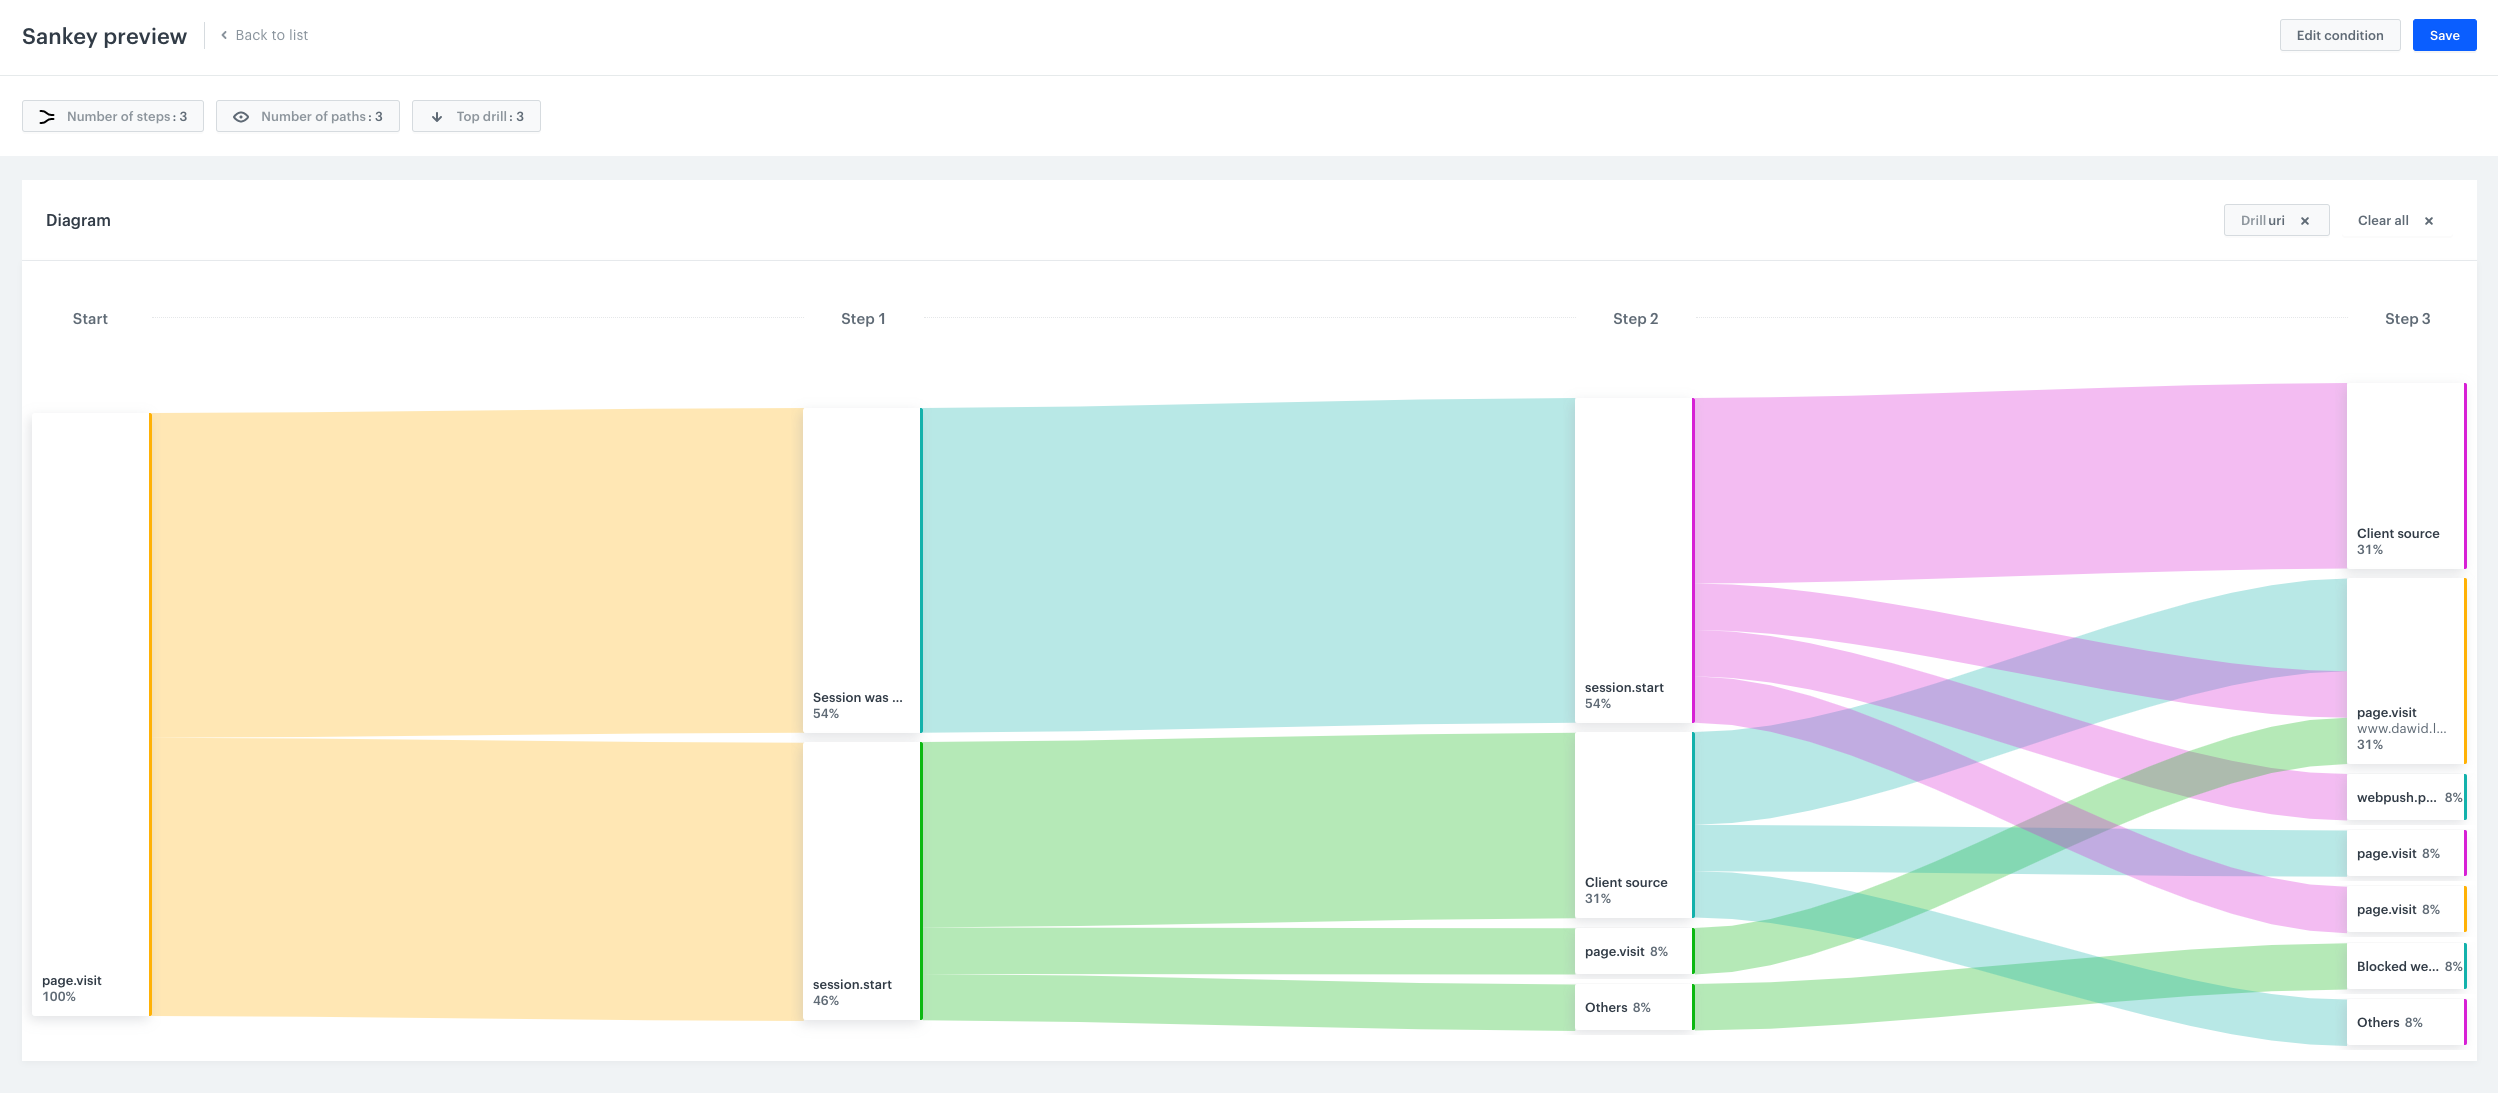
Once you create a Sankey diagram, you may see the results of the analysis. They are presented in the form of the chart which visualize the steps taken by customers before or after an event (depending on the option selected when you created the chart).
-
Go to Analytics > Sankey Diagrams.
-
Find a Sankey diagram you want to see the preview of.
-
Click the
 icon on the right and select the Preview option.
 -
You can perform several actions:
- If you want to display the parameters of an event (such as URL in
page visit), click the event under the Step column and select the Drill down option. Then, from the list of event parameters, select a parameter.
Tip: Each event parameter is displayed on the chart as a separate path. They take the place of non-drilled events. It happens due to the limit defined by the number of paths.- If you want to get the list of the customers who arrived to a point in the path, click the event under the Step column and select the Open in Profiles option.
- If you want to change the number of the top event parameters chosen through drill downs, click the Top drill button and choose the number of the results you want to display.
- If you want to change the number of paths, click the Number of paths button and select a number.
- If you want to change the number of steps, click the Number of steps button and select a number.
- If you want to display the parameters of an event (such as URL in